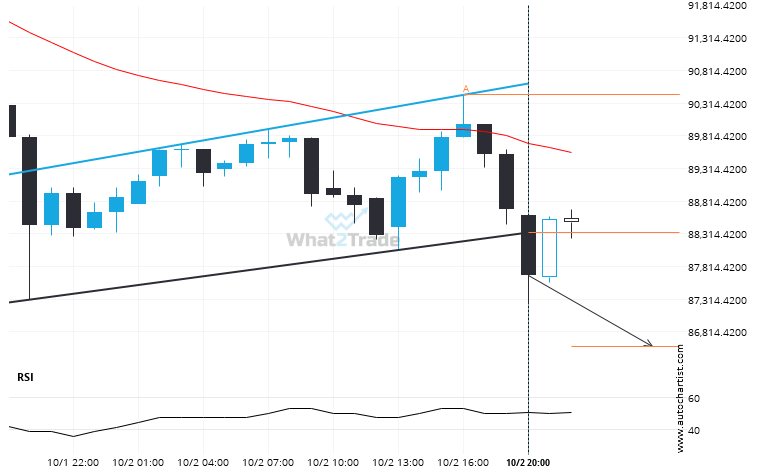
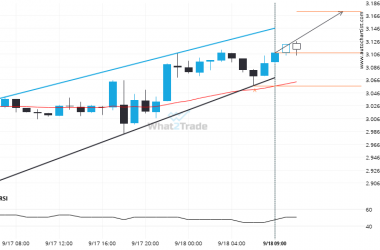
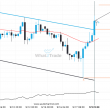
BTCAUD moved through the support line of a Flag at 88329.63647058823 on the 1 hour chart. This line has been tested a number of times in the past and this breakout could mean an upcoming change from the current trend. It may continue in its current direction toward 86584.1455.
ARTÍCULOS RELACIONADOS
After testing the resistance line numerous times, ETHAUD is once again approaching this line. Can we expect a bullish trend to follow?
A Rising Wedge pattern was identified on ETHAUD at 5946.21, creating an expectation that it may move to…
Supports and resistances are primary concepts of technical analysis. LTCEUR is heading for an important price of 92.3300 – read about what this could mean for the future.
The movement of LTCEUR towards 92.3300 price line is yet another test of the line it reached numerous…
Because DASHGBP formed a Triangle pattern, we expect it to touch the resistance line. If it breaks through resistance it may move much higher
An emerging Triangle has been detected on DASHGBP on the 4 hour chart. There is a possible move…