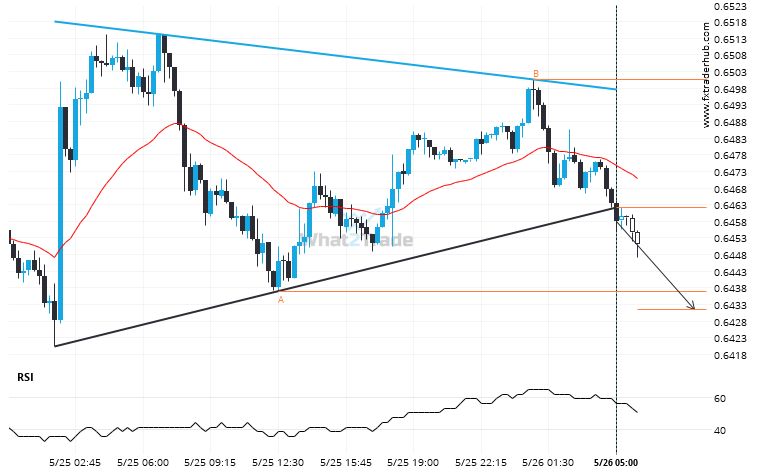
NZD/USD has broken through a support line of a Triangle chart pattern. If this breakout holds true, we may see the price of NZD/USD testing 0.6431 within the next 8 hours. But don’t be so quick to trade, it has tested this line in the past, so you should confirm the breakout before taking any action.
ARTÍCULOS RELACIONADOS
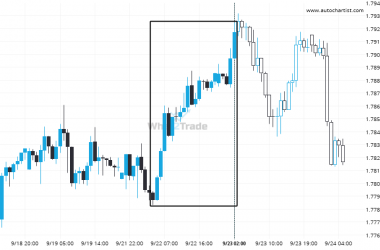
EURAUD – Large moves like this tend to draw attention.
EURAUD experienced an extremely large move that lasted 22. This ranks in the 96.0 percentile and is considered…
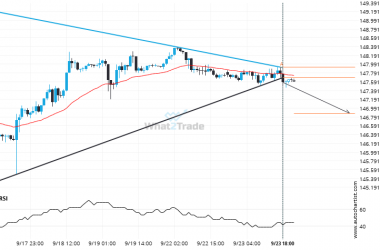
Breach of support could mean a start of a bearish trend on USDJPY
The breakout of USDJPY through the support line of a Triangle could be a sign of the road…
AUDJPY seems to be on its way to resistance – a possible opportunity?
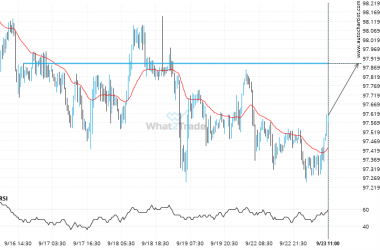
AUDJPY is moving towards a key resistance level at 97.8900. This is a previously tested level for AUDJPY.…

