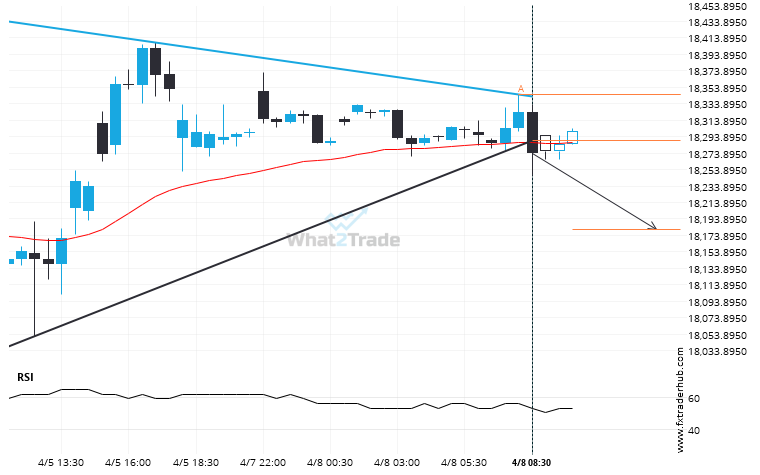
NAS100 has broken through a support line of a Triangle chart pattern. If this breakout holds true, we may see the price of NAS100 testing 18181.2734 within the next 5 hours. But don’t be so quick to trade, it has tested this line in the past, so you should confirm the breakout before taking any action.
ARTÍCULOS RELACIONADOS
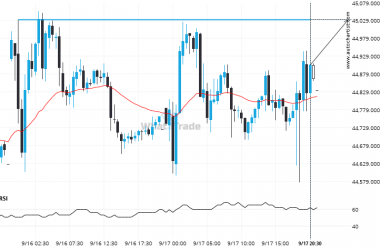
Supports and resistances are primary concepts of technical analysis. Nikkei 225 is heading for an important price of 45031.0000 – read about what this could mean for the future.
Nikkei 225 is moving towards a line of 45031.0000 which it has tested numerous times in the past.…
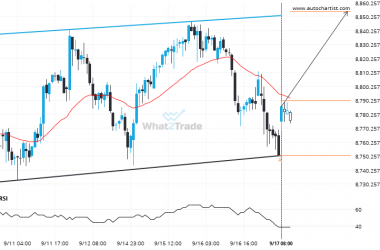
After testing the resistance line numerous times, ASX 200 is once again approaching this line. Can we expect a bullish trend to follow?
ASX 200 is heading towards the resistance line of a Channel Up. If this movement continues, the price…
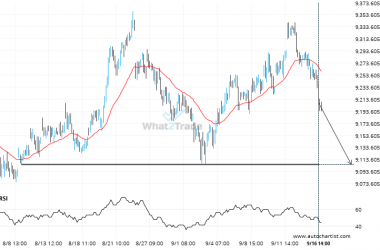
If you’re long FTSE 100 you should be aware of the rapidly approaching level of 9105.0000
FTSE 100 is about to retest a key horizontal support level near 9105.0000. It has tested this level…

