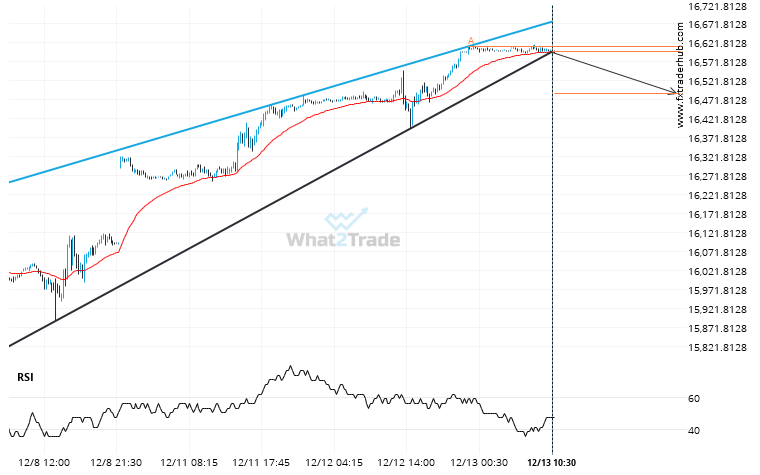
NAS100 has broken through the support line of a Rising Wedge technical chart pattern. Because we have seen it retrace from this line in the past, one should wait for confirmation of the breakout before taking any action. It has touched this line twice in the last 6 days and suggests a possible target level to be around 16488.6711 within the next 21 hours.
ARTÍCULOS RELACIONADOS
If you’re long FTSE 100 you should be aware of the rapidly approaching level of 9105.0000
FTSE 100 is about to retest a key horizontal support level near 9105.0000. It has tested this level…
DOW 30 formed a Falling Wedge on the 15 Minutes chart. Retest of support in sight.
DOW 30 is heading towards the support line of a Falling Wedge and could reach this point within…
DAX 40 keeps moving closer towards 23544.0000. Will it finally breach this level?
DAX 40 is moving towards a line of 23544.0000 which it has tested numerous times in the past.…