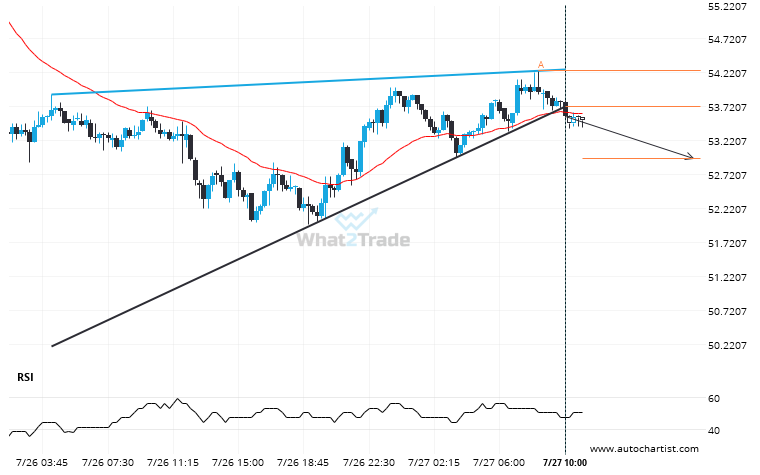
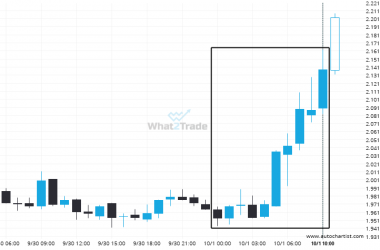
LTCUSD has broken through a support line of a Rising Wedge chart pattern. If this breakout holds true, we may see the price of LTCUSD testing 52.9551 within the next 9 hours. But don’t be so quick to trade, it has tested this line in the past, so you should confirm the breakout before taking any action.
ARTÍCULOS RELACIONADOS
A Channel Up has formed, BTCUSD is approaching resistance. Can we expect a breakout and the start of a new trend or a reversal?
BTCUSD was identified at around 118356.65 having recently rebounded of the resistance on the 30 Minutes data interval.…
Important price line breached by ETHBTC. This price has been tested numerous times before.
ETHBTC has broken through a line of 0.0367. If this breakout holds true, we could see the price…
DASHBTC – Large moves like this tend to draw attention.
DASHBTC reached 0.0002138 after a 9.47% move spanning 10 hours.

