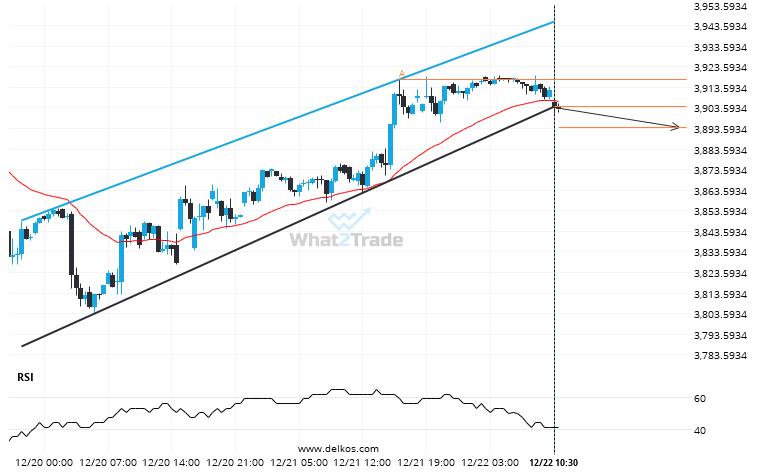
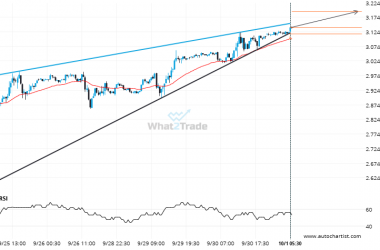
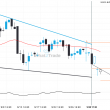
E-mini S&P 500 MARCH 2023 has broken through a support line of a Channel Up chart pattern. If this breakout holds true, we may see the price of E-mini S&P 500 MARCH 2023 testing 3893.8115 within the next 17 hours. But don’t be so quick to trade, it has tested this line in the past, so you should confirm the breakout before taking any action.
ARTÍCULOS RELACIONADOS
Natural Gas through 2.9504473684210524. Is this a confirming a breakout? Will it continue its path in the current trend toward 2.9896?
The breakout of Natural Gas through the resistance line of a Triangle could be a sign of the…
If you’re long Gold Spot you should be aware that 3377.0901 has just been breached – a level tested 3 time in the past
Gold Spot has broken through a line of 3377.0901. If this breakout holds true, we could see the…
US Oil is signaling a possible trend reversal on the intraday charts with price not breaching support.
US Oil was identified at around 63.7855 having recently rebounded of the support on the 1 hour data…