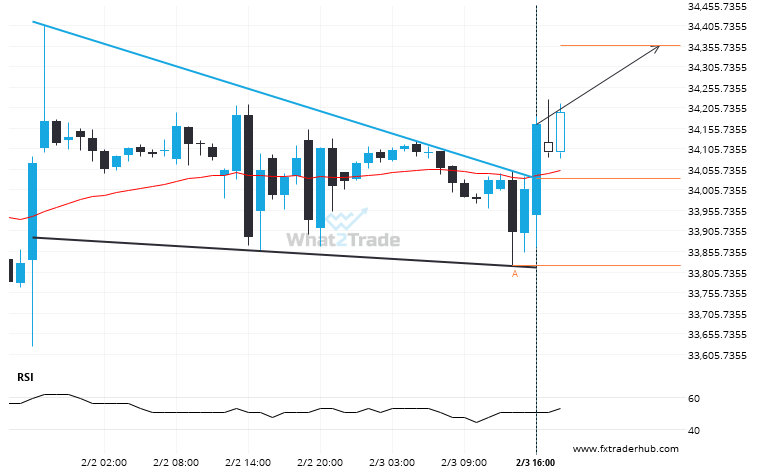
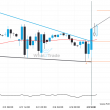
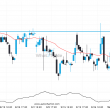
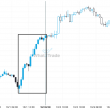
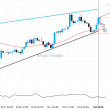
US30 has broken through a resistance line of a Falling Wedge chart pattern. If this breakout holds true, we may see the price of US30 testing 34358.3030 within the next 11 hours. But don’t be so quick to trade, it has tested this line in the past, so you should confirm the breakout before taking any action.
ARTÍCULOS RELACIONADOS
ASX 200 broke through a support at 2025-05-14T18:00:00.000Z, with the price momentum continuing to move in an downward direction over the next hours, good opportunity presents itself with the price expected to reach 8153.5369.
ASX 200 moved through the support line of a Channel Up at 8203.2 on the 4 hour chart.…
Is the extremely large movement on CAC 40 a sign of things to come?
CAC 40 rose sharply for 38 days – which is an excessively big movement for this instrument; exceeding…
FTSE 100 likely to test 8545.2598 in the near future. Where to next?
FTSE 100 is heading towards a line of 8545.2598. If this movement continues, the price of FTSE 100…