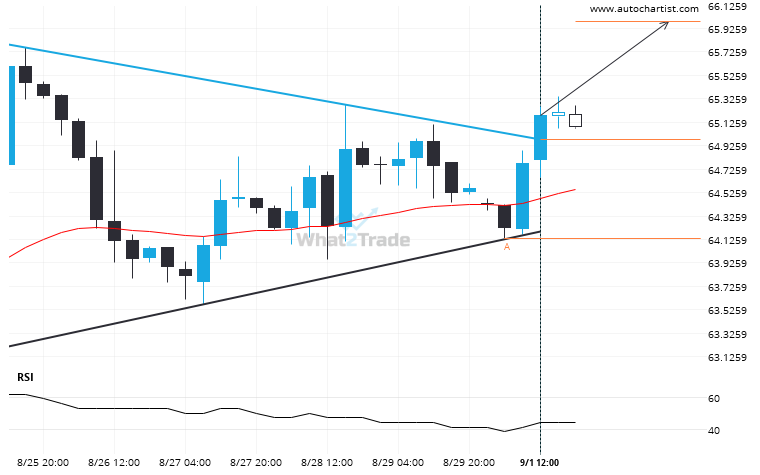
US Oil moved through the resistance line of a Triangle at 64.98008333333334 on the 4 hour chart. This line has been tested a number of times in the past and this breakout could mean an upcoming change from the current trend. It may continue in its current direction toward 65.9871.
ARTÍCULOS RELACIONADOS
Natural Gas has shown consistent movement in one direction.
Natural Gas posted 7 consecutive candles over the last 9 day — an unusually large movement.
US Oil keeps moving closer towards 64.8865. Will it finally breach this level?
US Oil is approaching a resistance line at 64.8865. If it hits the resistance line, it may break…
Important support line being approached by US Oil. This price has been tested numerous time in the last 12 days
US Oil is moving towards a support line which it has tested numerous times in the past. We…