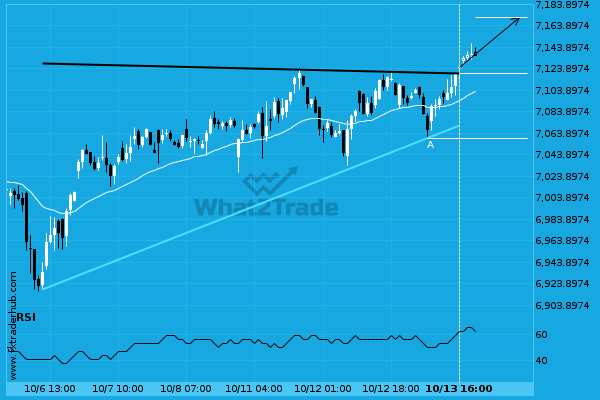
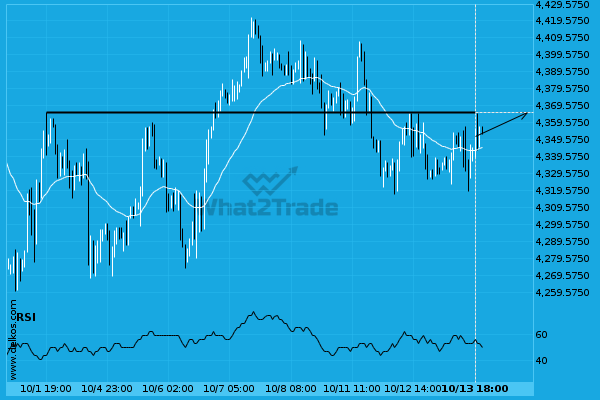
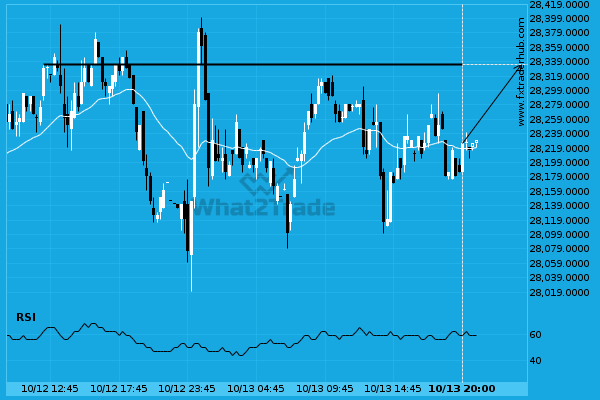
UK100 has broken through a resistance line of a Ascending Triangle chart pattern. If this breakout holds true, we may see the price of UK100 testing 7171.1880 within the next 2 days. But don’t be so quick to trade, it has tested this line in the past, so you should confirm the breakout before taking any action.
ARTÍCULOS RELACIONADOS
NAS 100 – approaching a resistance line that has been previously tested at least twice in the past
The movement of NAS 100 towards the resistance line of a Rising Wedge is yet another test of…
Nikkei 225 reached 47590.0 after a 3.64% move spanning 3 days.
Nikkei 225 reached 47590.0 after a 3.64% move spanning 3 days.
After testing 6741.8398 numerous times, US 500 has finally broken through. Can we expect a bullish trend to follow?
The price of US 500 in heading in the direction of 6757.0430. Despite the recent breakout through 6741.8398…

