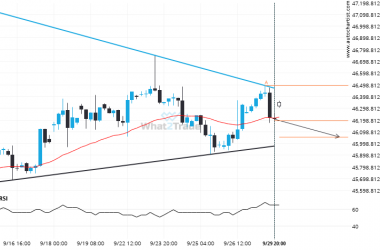
UK100 has broken through a resistance line of a Falling Wedge chart pattern. If this breakout holds true, we expect the price of UK100 to test 7491.1553 within the next 12 hours. But don’t be so quick to trade, it has tested this line in the past, so you should probably confirm the breakout before placing any trades.
ARTÍCULOS RELACIONADOS
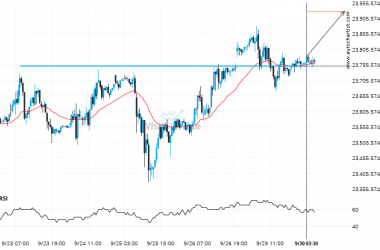
After testing 23751.1992 numerous times, DAX 40 has finally broken through. Can we expect a bullish trend to follow?
DAX 40 has broken through a resistance line. Because we have seen it retrace from this price in…
Important support line being approached by DOW 30. This price has been tested numerous time in the last 19 days
DOW 30 is moving towards a support line which it has tested numerous times in the past. We…
ASX 200 experienced a 1.78% bullish move in just 4 days. The magnitude speaks for itself.
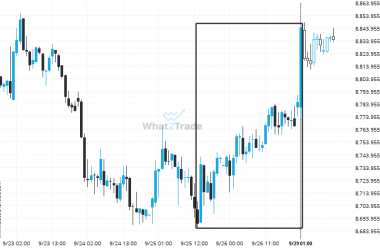
ASX 200 has moved higher by 1.78% from 8689.4 to 8844.2 in the last 4 days.

