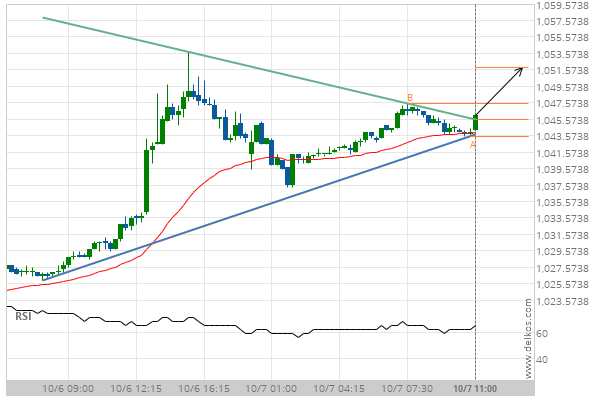
Soybeans NOVEMBER 2020 has broken through a resistance line of a Triangle chart pattern. If this breakout holds true, we expect the price of Soybeans NOVEMBER 2020 to test 1051.9078 within the next 7 hours. But don’t be so quick to trade, it has tested this line in the past, so you should probably confirm the breakout before placing any trades.
ARTÍCULOS RELACIONADOS
Gold Spot seems to be on its way to resistance – a possible opportunity?
Gold Spot is approaching a resistance line at 3871.7600. If it hits the resistance line, it may break…
Important support line being approached by US Oil. This price has been tested numerous time in the last 8 days
An emerging Falling Wedge has been detected on US Oil on the 30 Minutes chart. There is a…
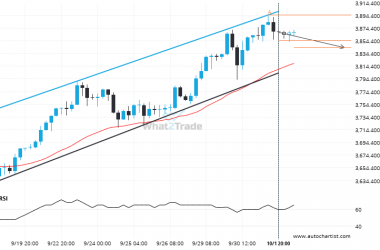
Because Gold Spot formed a Channel Up pattern, we expect it to touch the support line. If it breaks through support it may move much lower
Gold Spot is moving towards a support line. Because we have seen it retrace from this line before,…

