NAS100 has broken through a resistance line of a Triangle chart pattern. If this breakout holds true, we expect the price of NAS100 to test 12468.1781 within the next 4 days. But don’t be so quick to trade, it has tested this line in the past, so you should probably confirm the breakout before placing any trades.
ARTÍCULOS RELACIONADOS
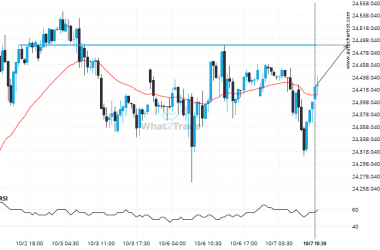
After testing 24489.3008 numerous times, DAX 40 is once again approaching this price point. Can we expect a bullish trend to follow?
The movement of DAX 40 towards 24489.3008 price line is yet another test of the line it reached…
NAS 100 – approaching a resistance line that has been previously tested at least twice in the past
The movement of NAS 100 towards the resistance line of a Rising Wedge is yet another test of…
Nikkei 225 reached 47590.0 after a 3.64% move spanning 3 days.
Nikkei 225 reached 47590.0 after a 3.64% move spanning 3 days.


