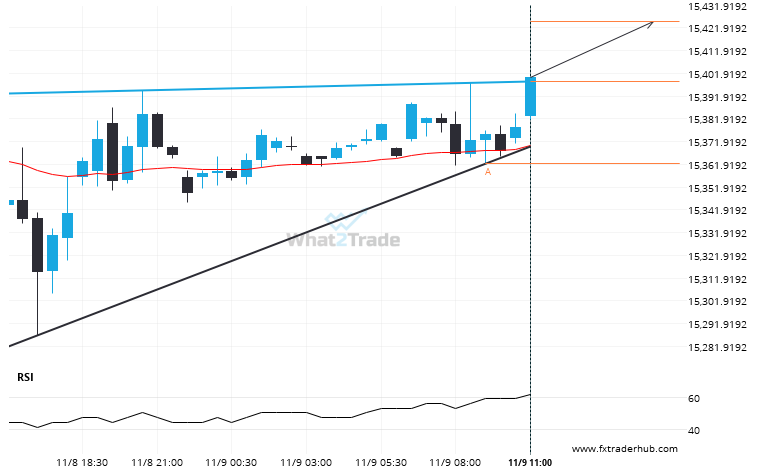
NAS100 has broken through a resistance line of a Ascending Triangle and suggests a possible movement to 15424.7667 within the next 5 hours. It has tested this line in the past, so one should probably wait for a confirmation of this breakout before taking action. If the breakout doesn’t confirm, we could see a retracement back to lines seen in the last 22 hours.
ARTÍCULOS RELACIONADOS
Supports and resistances are primary concepts of technical analysis. DAX 40 is heading for an important price of 23798.8008 – read about what this could mean for the future.
A strong support level has been identified at 23798.8008 on the 30 Minutes DAX 40 chart. DAX 40…
Breach of resistance could mean a start of a bullish trend on CAC 40
Triangle pattern identified on CAC 40 has broken through a resistance level with the price momentum continuing to…
Important price line being approached by FTSE 100. This price has been tested numerous times before.
FTSE 100 is moving towards a key support level at 9090.7998. FTSE 100 has previously tested this level…