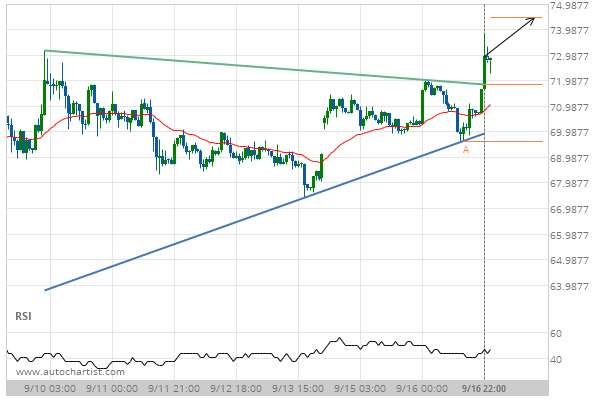
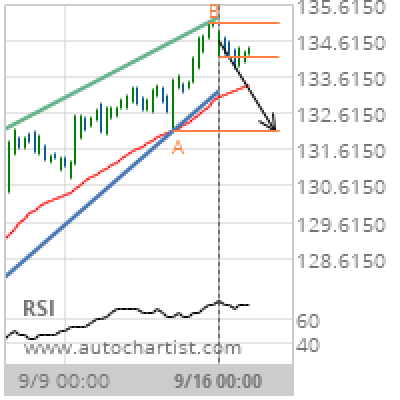
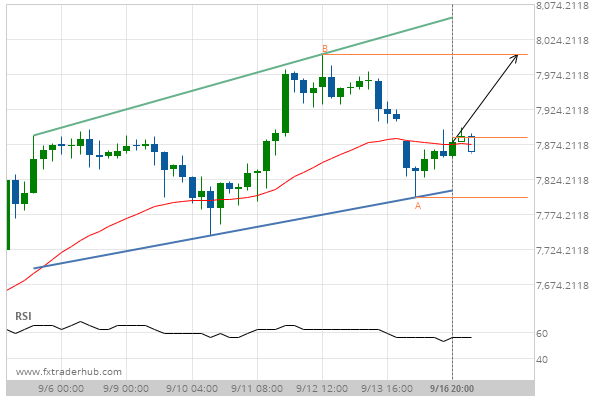
LTCUSD has broken through a resistance line of a Triangle chart pattern. If this breakout holds true, we expect the price of LTCUSD to test 74.4541 within the next 2 days. But don’t be so quick to trade, it has tested this line in the past, so you should probably confirm the breakout before placing any trades.
ARTÍCULOS RELACIONADOS
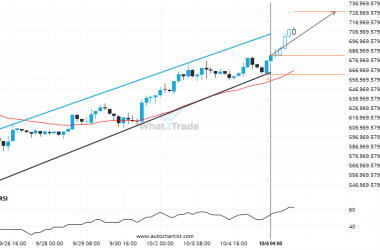
Because ETHJPY formed a Channel Up pattern, we expect it to touch the resistance line. If it breaks through resistance it may move much higher
ETHJPY is approaching the resistance line of a Channel Up. It has touched this line numerous times in…
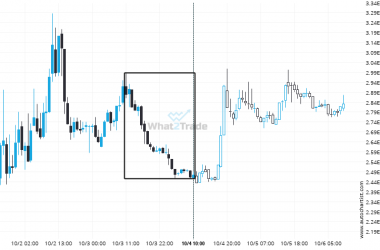
DASHBTC experienced a 14.01% bearish move in just 23 hours. The magnitude speaks for itself.
DASHBTC recorded a considerable move in the last 23 hours — one of its biggest in recent sessions.
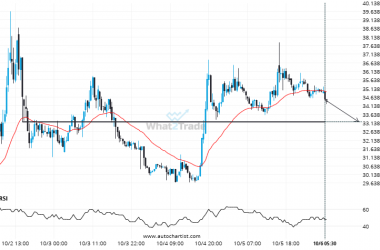
Supports and resistances are primary concepts of technical analysis. DASHUSD is heading for an important price of 33.2000 – read about what this could mean for the future.
DASHUSD is heading towards 33.2000 and could reach this point within the next 20 hours. It has tested…

