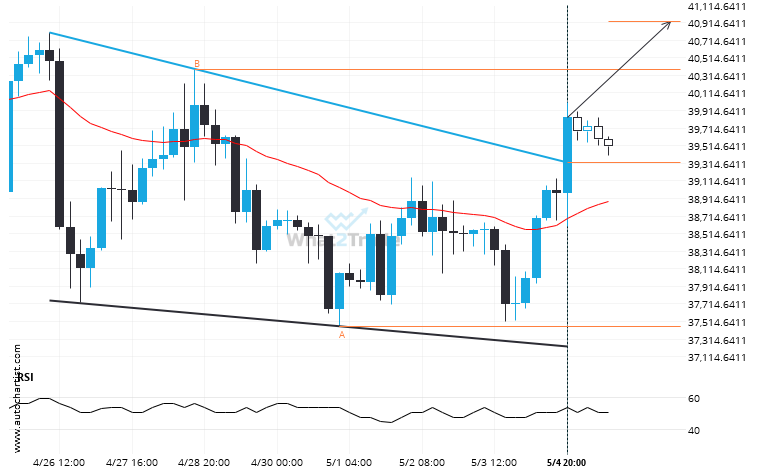
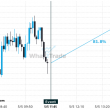
BTCUSD has broken through a resistance line of a Channel Down chart pattern. If this breakout holds true, we may see the price of BTCUSD testing 40929.5968 within the next 3 days. But don’t be so quick to trade, it has tested this line in the past, so you should confirm the breakout before taking any action.
ARTÍCULOS RELACIONADOS
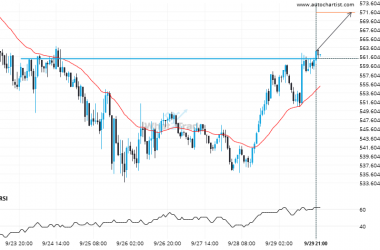
It’s time to make a decision on BCHUSD – its recent breach of 561.1700 could be a sign of a new trend to follow.
BCHUSD has broken through a line of 561.1700 and suggests a possible movement to 571.4180 within the next…
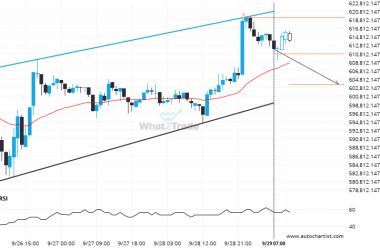
ETHJPY formed a Channel Up on the 1 hour chart. Retest of support in sight.
An emerging Channel Up has been detected on ETHJPY on the 1 hour chart. There is a possible…
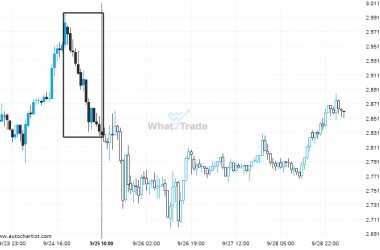
XRPUSD – Large moves like this tend to draw attention.
XRPUSD reached 2.828 after a 5.23% move spanning 15 hours.

