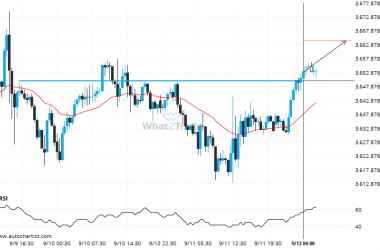
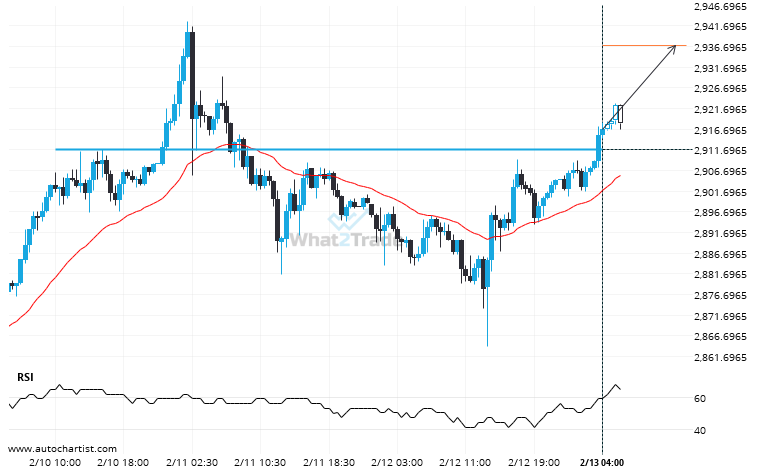
Gold Spot has breached the resistance line at 2911.7300. It may continue the bullish trend towards 2937.0010, or, it may prove to be yet another test of this level.
ARTÍCULOS RELACIONADOS
An unexpected large move has occurred on Gold Spot Daily chart! Is this a sign of something new? What can we expect?
A movement of 12% over 57 days on Gold Spot doesn’t go unnoticed. You may start considering where…
Brent Crude – It’s perhaps in these huge moves where the greatest opportunity lies
Brent Crude dropped sharply for day – which is an excessively big movement for this instrument; exceeding the…
After testing support twice in the past, Gold Spot has finally broken through. Can we expect a bearish trend to follow?
Gold Spot has broken through a support line of a Triangle chart pattern. If this breakout holds true,…