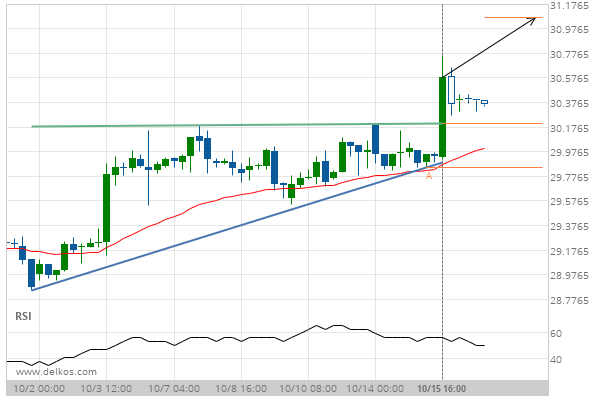
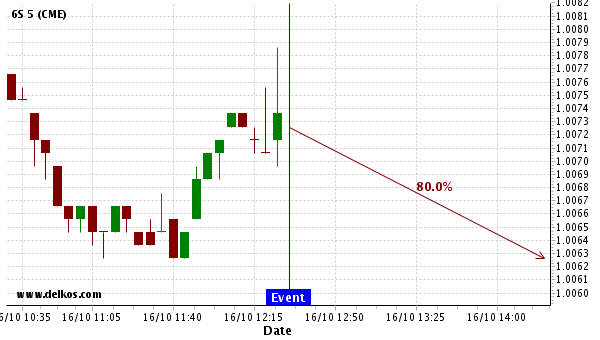
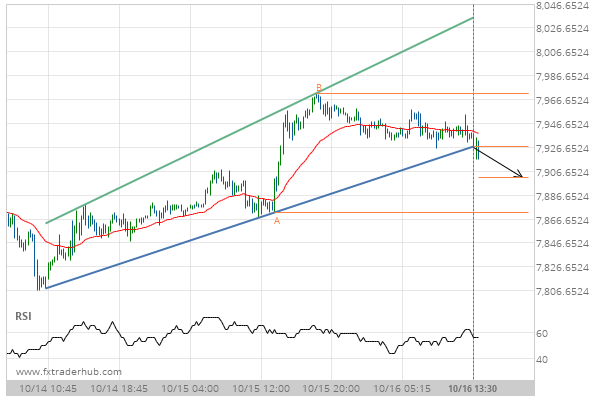
Soybean Oil DECEMBER 2019 has broken through a resistance line of a Ascending Triangle and suggests a possible movement to 31.0657 within the next 2 days. It has tested this line in the past, so one should probably wait for a confirmation of this breakout before placing a trade. If the breakout doesn’t confirm, we could see a retracement back to lines seen in the last 15 days.
ARTÍCULOS RELACIONADOS
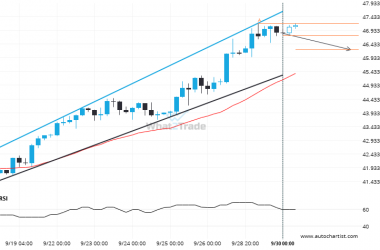
After testing the support line numerous times, Silver Spot is once again approaching this line. Can we expect a bearish trend to follow?
The movement of Silver Spot towards the support line of a Channel Up is yet another test of…
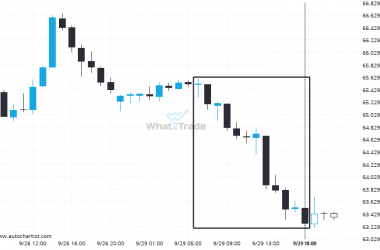
US Oil – Large moves like this tend to draw attention.
An unexpected large move occurred on US Oil 1 hour chart, starting at 65.5195 and reaching 63.2685. It…
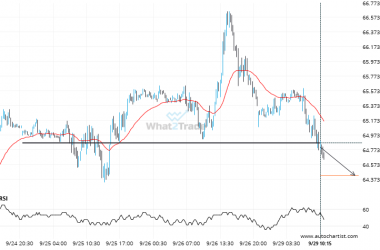
Breach of 64.8690 could mean a start of a bearish trend on US Oil
US Oil has broken through 64.8690 which it has tested numerous times in the past. We have seen…

