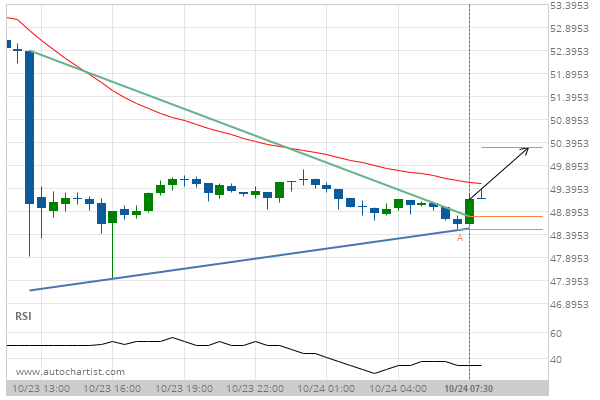
LTCUSD has broken through a resistance line of a Triangle and suggests a possible movement to 50.2718 within the next 5 hours. It has tested this line in the past, so one should probably wait for a confirmation of this breakout before placing a trade. If the breakout doesn’t confirm, we could see a retracement back to lines seen in the last 19 hours.
ARTÍCULOS RELACIONADOS
Will DASHEUR break through the resistance level it tested before?
DASHEUR is moving towards a line of 19.6500 which it has tested numerous times in the past. We…
After testing the support line numerous times, XRPUSD is once again approaching this line. Can we expect a bearish trend to follow?
Emerging Descending Triangle pattern in its final wave was identified on the XRPUSD 1 hour chart. After a…
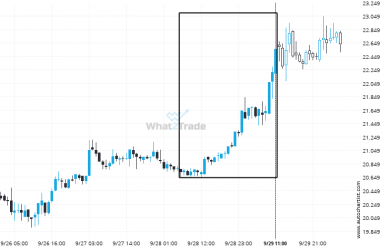
DASHUSD experienced a 8.88% bullish move in just 2 days. The magnitude speaks for itself.
DASHUSD reached 22.56 after a 8.88% move spanning 2 days.

