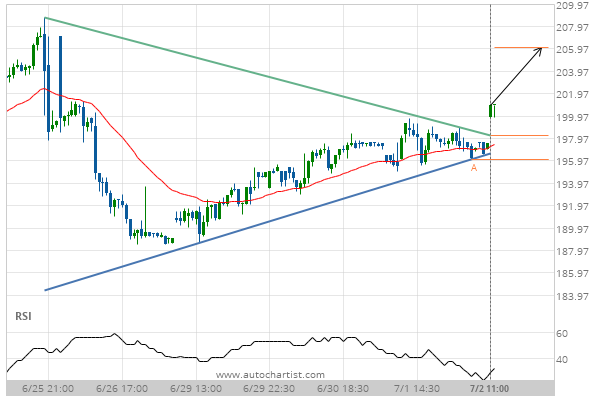
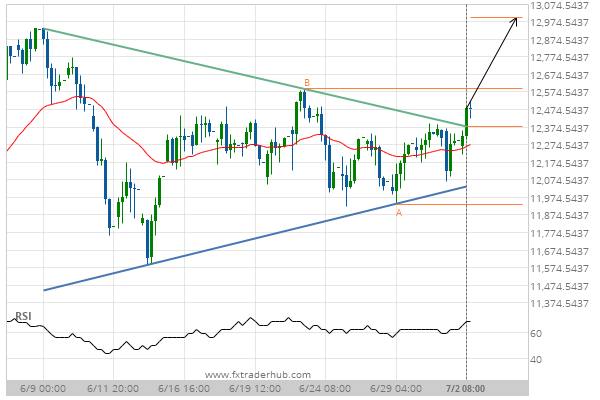
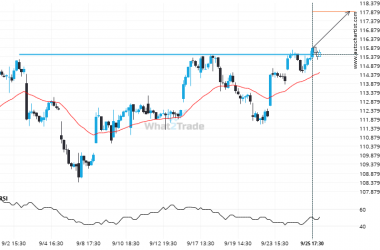
Goldman Sachs Group Inc. has broken through a resistance line of a Triangle and suggests a possible movement to 206.12 within the next 19 hours. It has tested this line in the past, so one should probably wait for a confirmation of this breakout before placing a trade. If the breakout doesn’t confirm, we could see a retracement back to lines seen in the last 7 days.
ARTÍCULOS RELACIONADOS
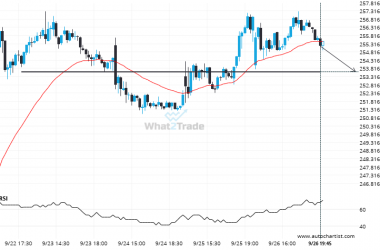
AAPL – approaching a price line that has been previously tested numerous times in the past
AAPL is heading towards a line of 253.6100. If this movement continues, the price of AAPL could test…
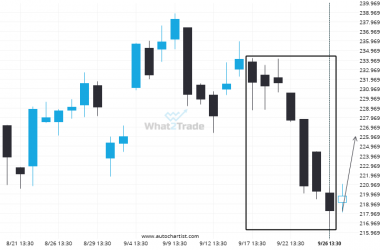
AMZN posted 7 consecutive bearish Daily candles.
AMZN moved lower from 233.7700 to 218.1650 after 7 consecutive daily candles over 10 days.
XOM – breach of price line that’s been previously tested numerous times before
XOM has breached the resistance line at 115.4800. It may continue the bullish trend towards 117.9020, or, it…

