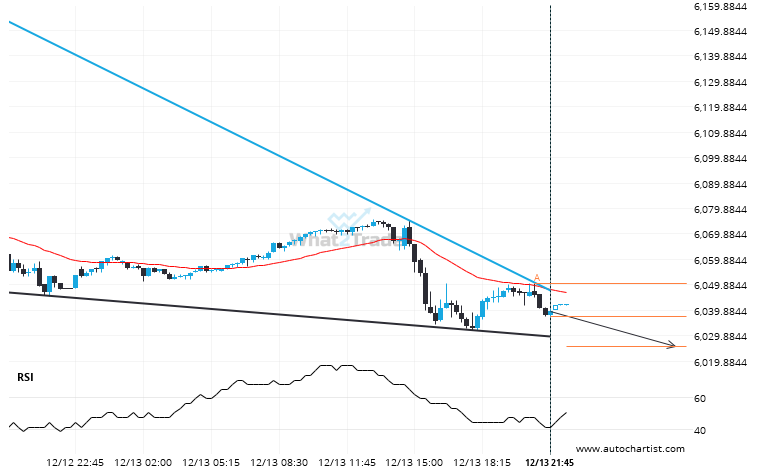
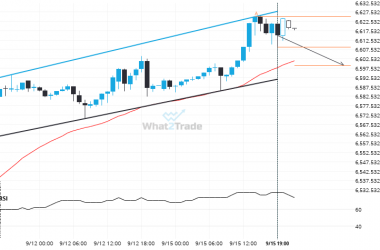
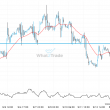
Emerging Falling Wedge detected on US 500 – the pattern is an emerging one and has not yet broken through resistance, but the price is expected to move up over the next few hours. The price at the time the pattern was found was 6037.57 and it is expected to move to 6025.5137.
ARTÍCULOS RELACIONADOS
Nikkei 225 through 38461.53846153846. Is this a confirming a breakout? Will it continue its path in the current trend toward 38204.2397?
Nikkei 225 has broken through the support line which it has tested twice in the past. We have…
After testing 7807.6001 numerous times, CAC 40 has finally broken through. Can we expect a bullish trend to follow?
CAC 40 is once again retesting a key horizontal resistance level at 7807.6001. It has tested this level…
A Rising Wedge has formed, FTSE 100 is approaching support. Can we expect a breakout and the start of a new trend or a reversal?
FTSE 100 is heading towards the resistance line of a Rising Wedge and could reach this point within…