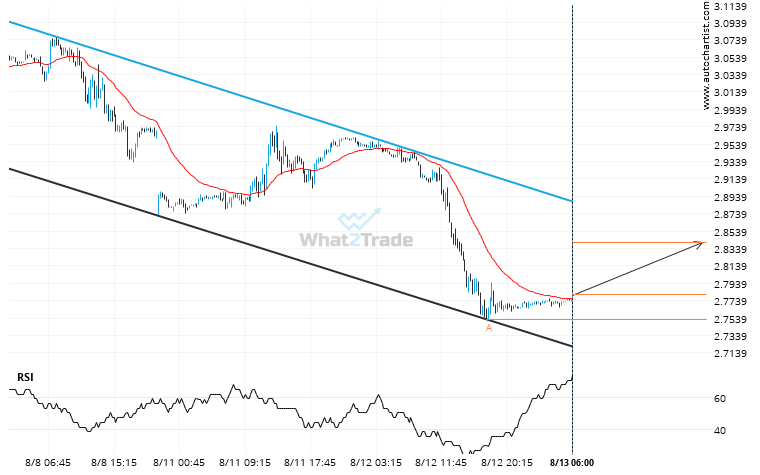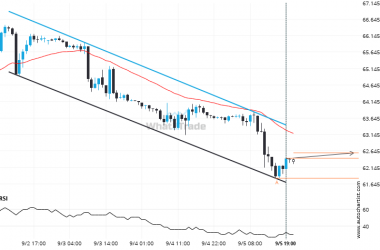
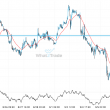
A Channel Down pattern was identified on Natural Gas at 2.7805, creating an expectation that it may move to the resistance line at 2.8407. It may break through that line and continue the bullish trend or it may reverse from that line.
Because Natural Gas formed a Channel Down pattern, we expect it to touch the resistance line. If it breaks through resistance it may move much higher