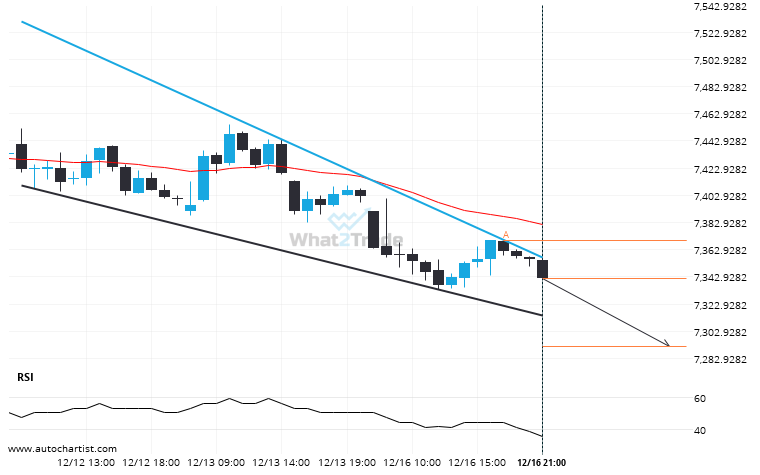
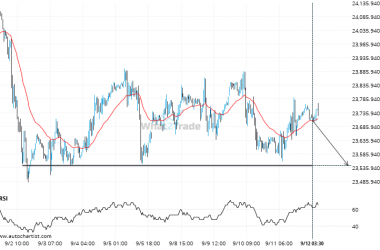
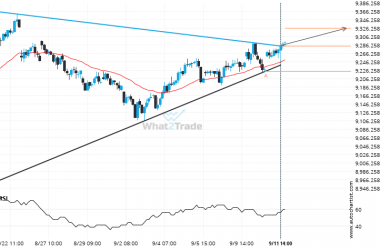
Emerging Falling Wedge pattern in its final wave was identified on the CAC 40 1 hour chart. After a strong bearish run, we find CAC 40 heading towards the upper triangle line with a possible resistance at 7291.5718. If the support shows to hold, the Falling Wedge pattern suggests a rebound back towards current levels.
Because CAC 40 formed a Falling Wedge pattern, we expect it to touch the support line. If it breaks through support it may move much lower