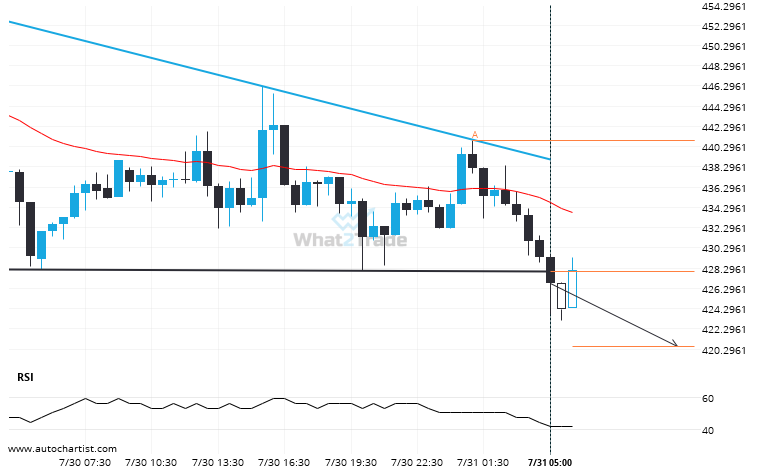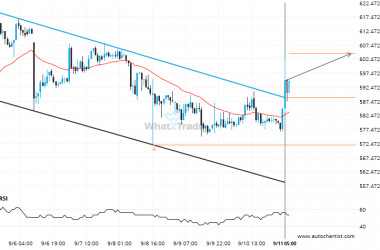
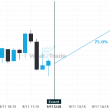
BCHUSD has broken through a support line of a Descending Triangle chart pattern. If this breakout holds true, we may see the price of BCHUSD testing 420.5228 within the next 6 hours. But don’t be so quick to trade, it has tested this line in the past, so you should confirm the breakout before taking any action.
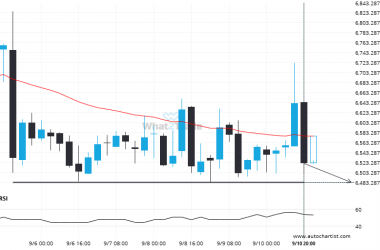
BCHUSD through 427.9772413793103. Is this a confirming a breakout? Will it continue its path in the current trend toward 420.5228?