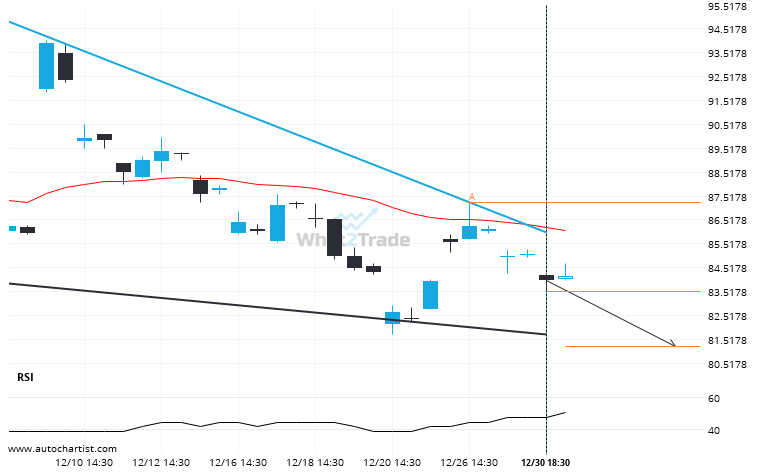
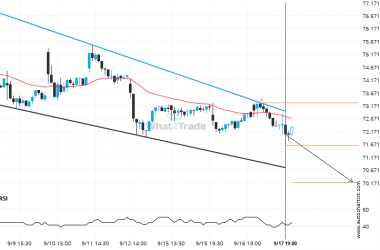
An emerging Falling Wedge has been detected on BABA on the 4 hour chart. There is a possible move towards 81.2081 next few candles. Once reaching resistance it may continue its bearish run or reverse back to current price levels.
ARTÍCULOS RELACIONADOS
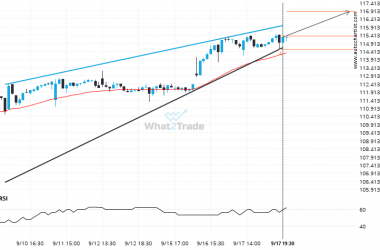
A possible move on XOM as it heads towards resistance
XOM is heading towards the resistance line of a Rising Wedge and could reach this point within the…
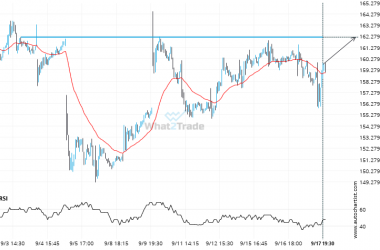
AMD keeps moving closer towards 162.2200. Will it finally breach this level?
AMD is en route to a very important line that will be a definite deciding factor of what…
NKE – approaching a support line that has been previously tested at least twice in the past
Emerging Falling Wedge detected on NKE – the pattern is an emerging one and has not yet broken…

