
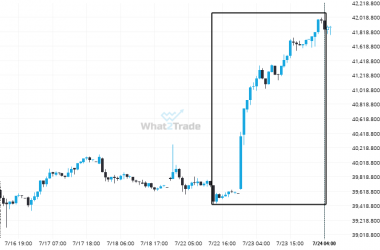
An unexpected large move has occurred on Nikkei 225 1 hour chart! Is this a sign of something new? What can we expect?
Nikkei 225 rose sharply for 2 days – which is an excessively big movement for this instrument; exceeding…
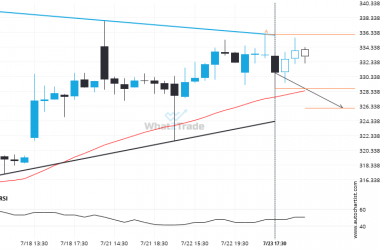
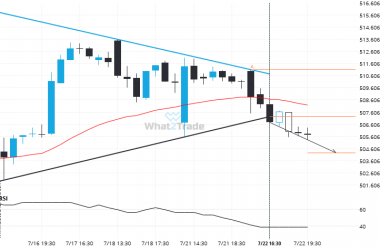
TSLA formed a Triangle on the 1 hour chart. Retest of support in sight.
TSLA is trapped in a Triangle formation, implying that a breakout is Imminent. This is a great trade-setup…
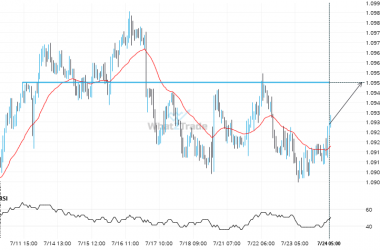
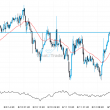
Will AUDNZD break through the resistance level it tested before?
A strong resistance level has been identified at 1.0954 on the 1 hour AUDNZD chart. AUDNZD is likely…
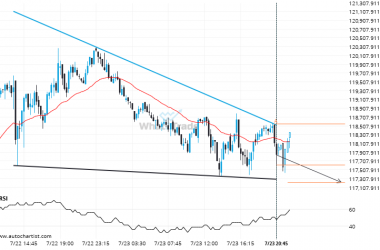
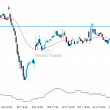
A possible move on BTCUSD as it heads towards support
The movement of BTCUSD towards the support line of a Falling Wedge is yet another test of the…
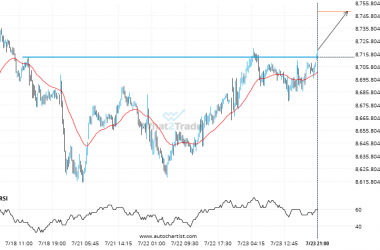
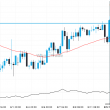
ASX 200 has broken through a level it has tested 3 times in the recent past.
ASX 200 has broken through 8713.0000 which it has tested numerous times in the past. We have seen…
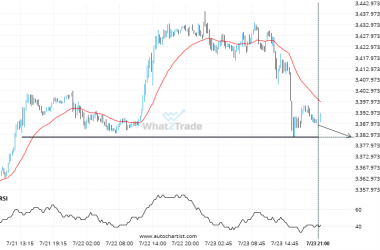
Gold Spot is approaching 3381.6589. We expect either a breakout through this line, or a rebound.
Gold Spot is moving towards a line of 3381.6589 which it has tested numerous times in the past.…
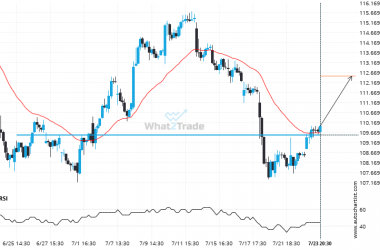
XOM – breach of price line that’s been previously tested numerous times before
XOM is once again retesting a key horizontal resistance level at 109.5450. It has tested this level 4…
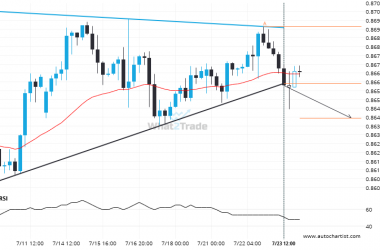
EURGBP through 0.8661379310344827. Is this a confirming a breakout? Will it continue its path in the current trend toward 0.8642?
EURGBP has broken through a support line of a Triangle chart pattern. If this breakout holds true, we…
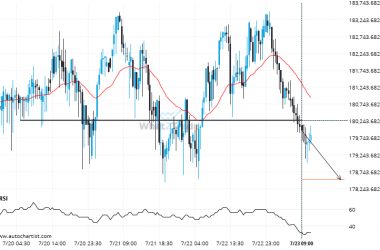
BTCAUD has broken through a level it has tested 4 times in the recent past.
BTCAUD has broken through 180271.0156 which it has tested numerous times in the past. We have seen it…
Breach of support could mean a start of a bearish trend on MSFT
MSFT has broken through a support line of a Triangle chart pattern. If this breakout holds true, we…