


LTCBTC – approaching a price line that has been previously tested numerous times in the past
The price of LTCBTC in heading back to the support area. It is possible that it will struggle…

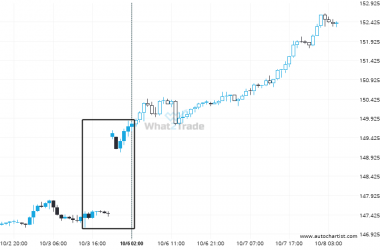
Gold Spot experienced a very large 48 days bullish move to 3909.648.
Gold Spot reached 3909.648 after a 16.81% move spanning 48 days.
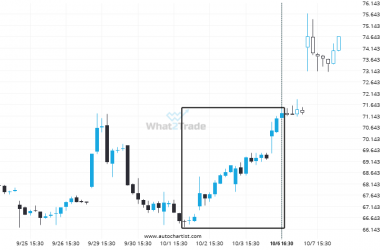
Big bullish swing on PYPL – this may be one of its more notable movements in the recent session.
PYPL reached 71.24 after a 7.18% move spanning 5 days.
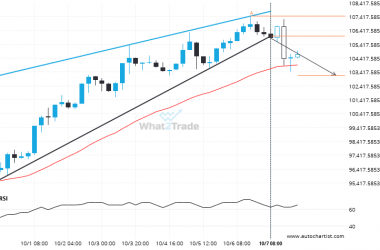
Extreme movement experienced on USDJPY. Check the chart to see what to do next.
USDJPY just posted a 1.58% move over the past 3 days – a move that won’t go unnoticed…
BTCEUR through 106021.44499999998. Is this a confirming a breakout? Will it continue its path in the current trend toward 103177.3167?
Rising Wedge pattern identified on BTCEUR has broken through a support level with the price momentum continuing to…
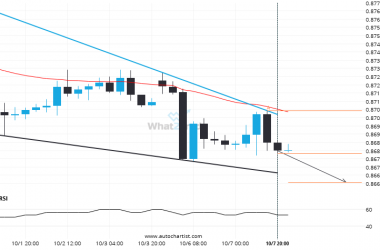
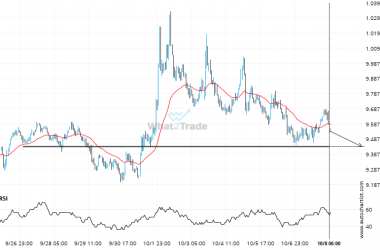
After testing the support line numerous times, EURGBP is once again approaching this line. Can we expect a bearish trend to follow?
EURGBP was identified at around 0.86786 having recently rebounded of the resistance on the 4 hour data interval.…

Brent Crude through 65.85670422535212. Is this a confirming a breakout? Will it continue its path in the current trend toward 67.7624?
Triangle pattern identified on Brent Crude has broken through a resistance level with the price momentum continuing to…
INTC formed a Rising Wedge on the 1 hour chart. Retest of resistance in sight.
Emerging Rising Wedge pattern in its final wave was identified on the INTC 1 hour chart. After a…
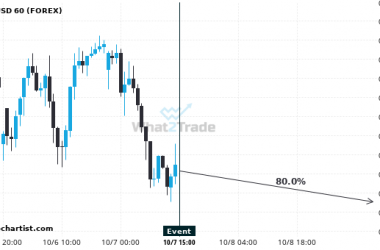
We expect a 42 pip movement on NZDUSD within 48 hours following the event release.
Based on the last 12 Ivey PMI s.a events in Canada, we expect NZDUSD to trend downwards later…
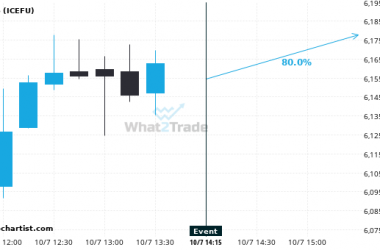
We expect a $1072362 movement on CC within 2 hours following the event release at 2025-10-07 14:00.
Based on the last 12 Ivey PMI s.a events in Canada, we expect CC to trend upwards later…