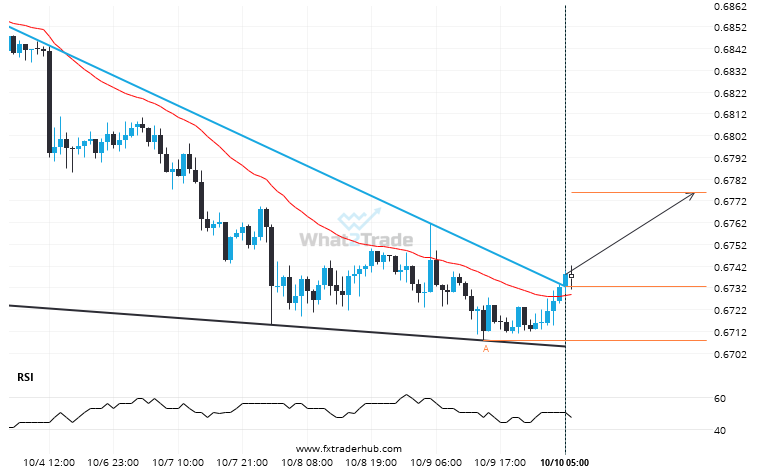
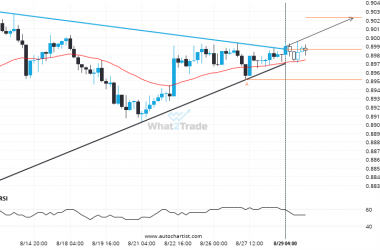
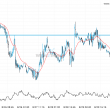
AUD/USD has broken through a resistance line of a Falling Wedge chart pattern. If this breakout holds true, we may see the price of AUD/USD testing 0.6776 within the next 2 days. But don’t be so quick to trade, it has tested this line in the past, so you should confirm the breakout before taking any action.
ARTÍCULOS RELACIONADOS
USDCAD – It’s perhaps in these huge moves where the greatest opportunity lies
USDCAD has moved lower by 2.39% from 1.42943 to 1.39528 in the last 11 days.
GBPJPY is quickly approaching the resistance line of a Inverse Head and Shoulders. We expect either a breakout through this line or a rebound.
GBPJPY is moving towards a resistance line. Because we have seen it retrace from this line before, we…
After experiencing a 1.94% bearish move in the space of 9 days, nobody knows where AUDNZD is headed.
Those of you that are trend followers are probably eagerly watching AUDNZD to see if its latest 1.94%…