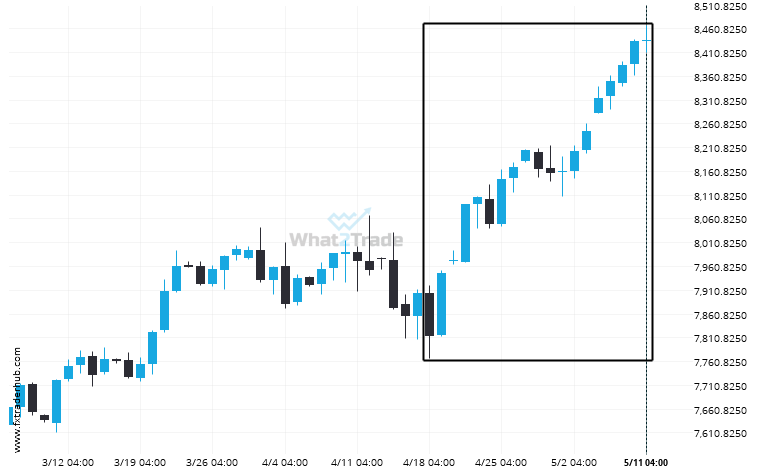
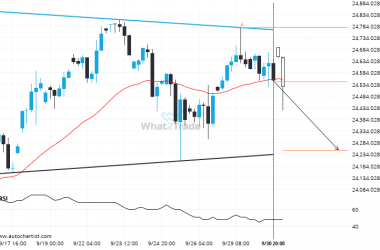
UK100 rose sharply for 23 days – which is an excessively big movement for this instrument; exceeding the 98% of past price moves. Even if this move is a sign of a new trend in UK100 there is a chance that we will witness a correction, no matter how brief.
ARTÍCULOS RELACIONADOS
Important resistance line being approached by FTSE 100. This price has been tested numerous time in the last 20 days
An emerging Rising Wedge has been detected on FTSE 100 on the 1 hour chart. There is a…
Rare bullish streak on the ASX 200 Daily chart.
ASX 200 posted a high rate of consecutive bullish candles on the Daily chart.
After testing 7892.2002 numerous times, CAC 40 has finally broken through. Can we expect a bullish trend to follow?
CAC 40 has broken through 7892.2002 which it has tested numerous times in the past. We have seen…