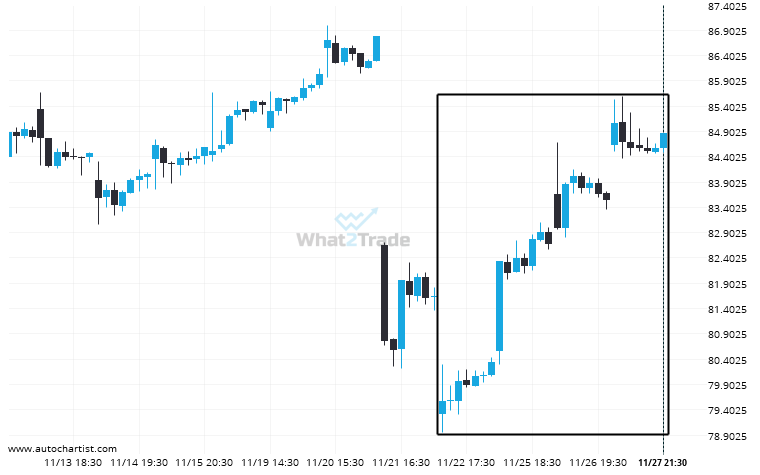
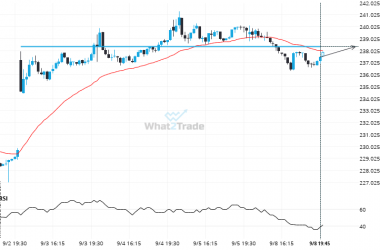
Those of you that are trend followers are probably eagerly watching BIDU to see if its latest 6.65% move continues. If not, the mean-reversion people out there will be delighted with this exceptionally large 6 days move.
ARTÍCULOS RELACIONADOS
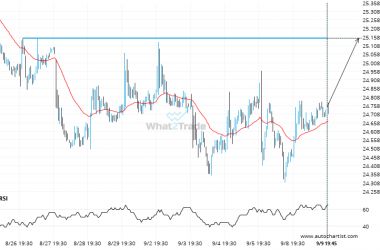
A final push possible on PFE as it starts approaching a price line of 25.1500.
PFE is moving towards a key resistance level at 25.1500. This is a previously tested level for PFE.…
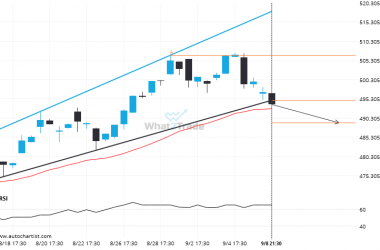
BRK.B breakout from a Channel Up trade setup. Will it continue this trend to hit the target price?
BRK.B has broken through the support line of a Channel Up technical chart pattern. Because we have seen…
AAPL – approaching a price line that has been previously tested numerous times in the past
AAPL is about to retest a key horizontal resistance level near 238.3750. It has tested this level 4…

