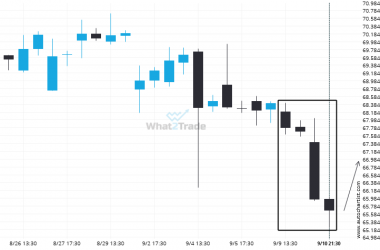
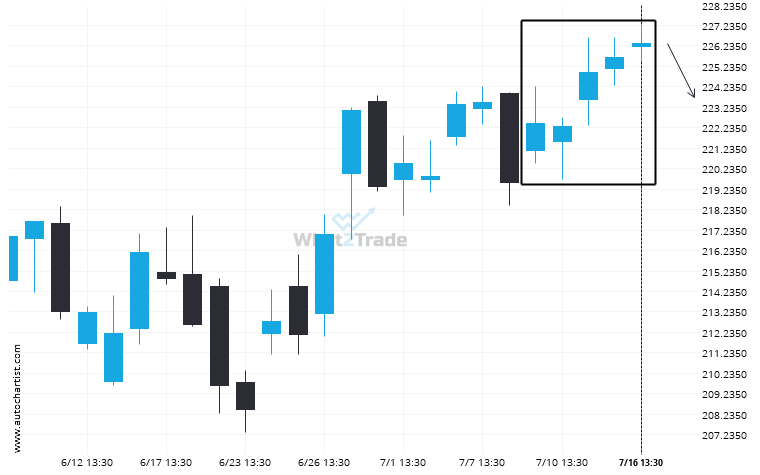
Due to the rate of consecutive bullish candles on AMZN Daily chart we could be in for a price correction. If not, this trend could be a sign of things to come
ARTÍCULOS RELACIONADOS
AMD is quickly approaching a very important level it has previously tested numerous times in the past
The price of AMD in heading back to the resistance area. It is possible that it will struggle…
TSLA through 323.62452380952374. Is this a confirming a breakout? Will it continue its path in the current trend toward 369.9006?
TSLA has broken through the resistance line of a Triangle technical chart pattern. Because we have seen it…
V is approaching 338.0450. We expect either a breakout through this line, or a rebound.
V is approaching a resistance line at 338.0450. If it hits the resistance line, it may break through…