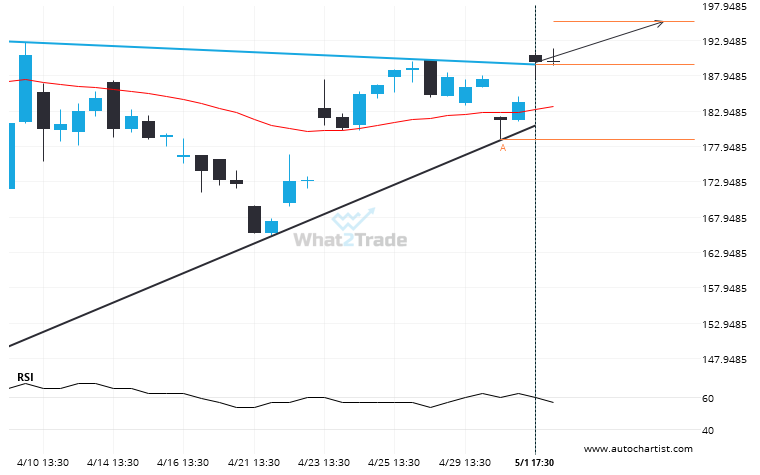
The last 25 4 hour candles on AMZN formed a Triangle pattern and broken out through the pattern lines, indicating a possible bullish movement towards the price level of 195.6467.
ARTÍCULOS RELACIONADOS
Could a large bullish move on MSFT be a sign of things to come?
A movement of 10.7% over 2 days on MSFT doesn’t go unnoticed. You may start considering where it’s…
After testing 56.0150 numerous times, NKE has finally broken through. Can we expect a bearish trend to follow?
NKE has breached the support line at 56.0150. It may continue the bearish trend towards 53.4235, or, it…
ADBE formed a Rising Wedge on the 30 Minutes chart. Retest of resistance in sight.
Emerging Rising Wedge detected on ADBE – the pattern is an emerging one and has not yet broken…