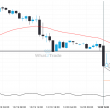
Soybean Oil January 2024 is once again retesting a key horizontal support level at 50.1900. It has tested this level 4 times in the recent past and could simply bounce off like it did last time. However, after this many tries, maybe it’s ready to start a new trend.
ARTÍCULOS RELACIONADOS
Breach of resistance could mean a start of a bullish trend on US Oil
US Oil moved through the resistance line of a Triangle at 64.98008333333334 on the 4 hour chart. This…
Natural Gas has shown consistent movement in one direction.
Natural Gas posted 7 consecutive candles over the last 9 day — an unusually large movement.
US Oil keeps moving closer towards 64.8865. Will it finally breach this level?
US Oil is approaching a resistance line at 64.8865. If it hits the resistance line, it may break…