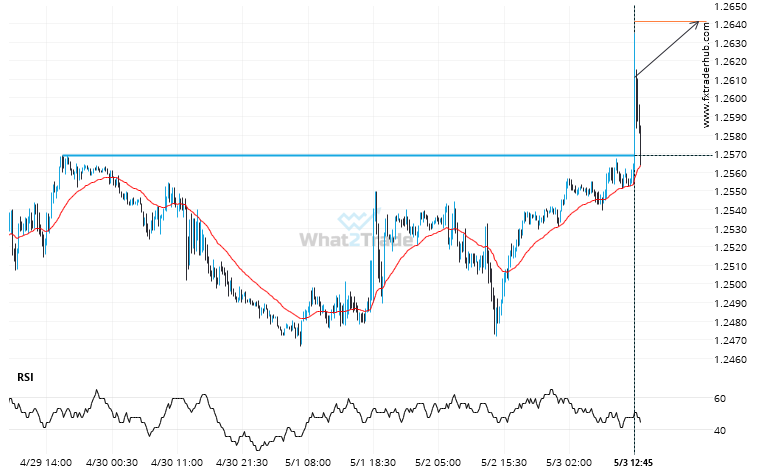
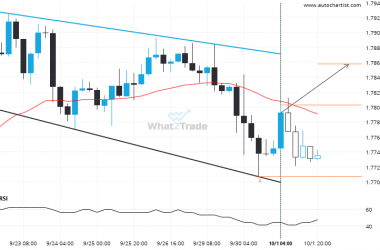
GBP/USD has broken through a resistance line. It has touched this line numerous times in the last 4 days. This breakout shows a potential move to 1.2641 within the next 22 hours. Because we have seen it retrace from this level in the past, one should wait for confirmation of the breakout.
ARTÍCULOS RELACIONADOS
GBPJPY formed a Falling Wedge on the 4 hour chart. Retest of support in sight.
The movement of GBPJPY towards the support line of a Falling Wedge is yet another test of the…
Will AUDNZD break through the resistance level it tested before?
A strong resistance level has been identified at 1.0954 on the 1 hour AUDNZD chart. AUDNZD is likely…
EURGBP through 0.8661379310344827. Is this a confirming a breakout? Will it continue its path in the current trend toward 0.8642?
EURGBP has broken through a support line of a Triangle chart pattern. If this breakout holds true, we…