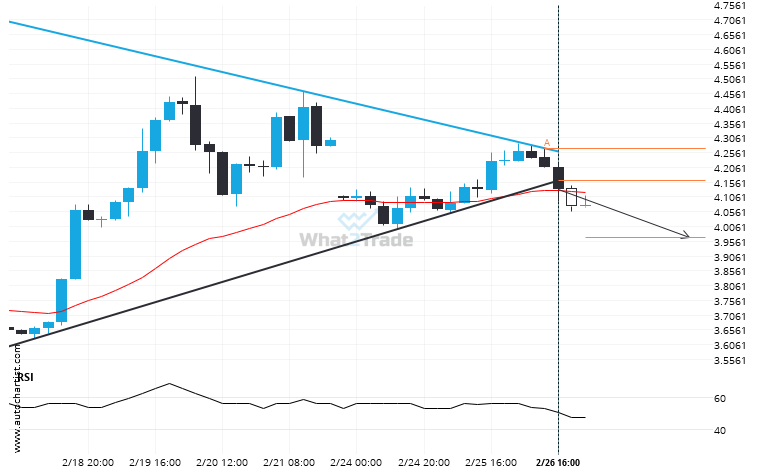
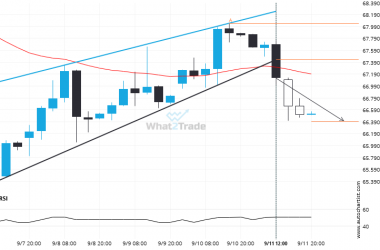
The last 17 4 hour candles on Natural Gas formed a Triangle pattern and broken out through the pattern lines, indicating a possible bearish movement towards the price level of 3.9685.
After testing support twice in the past, Natural Gas has finally broken through. Can we expect a bearish trend to follow?