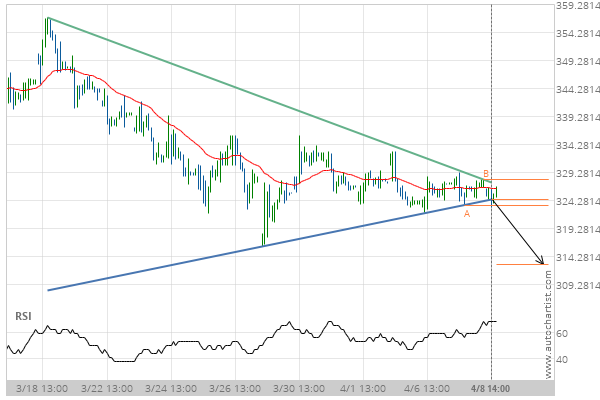
The breakout of Goldman Sachs Group Inc. through the support line of a Triangle could be a sign of the road ahead. If this breakout persists, we expect the price of Goldman Sachs Group Inc. to test 312.83 within the next 3 days. One should always be cautious before placing a trade, wait for confirmation of the breakout before putting any money down.
After testing support twice in the past, Goldman Sachs Group Inc. has finally broken through. Can we expect a bearish trend to follow?