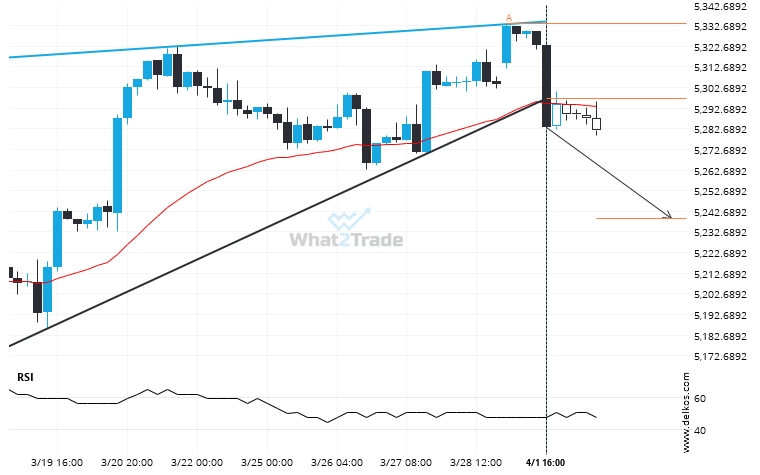
The last 21 4 hour candles on E-Mini S&P 500 June 2024 formed a Rising Wedge pattern and broken out through the pattern lines, indicating a possible bearish movement towards the price level of 5239.1387.
ARTÍCULOS RELACIONADOS
US Oil is signaling a possible trend reversal on the intraday charts with price not breaching resistance.
A Channel Up pattern was identified on US Oil at 61.7135, creating an expectation that it may move…
Gold Spot through 3225.946052631579. Is this a confirming a breakout? Will it continue its path in the current trend toward 3282.6858?
Gold Spot has broken through the resistance line which it has tested twice in the past. We have…
Gold Spot moves lower to 3231.5055 in the last 3 days.
For those of you that don’t believe in trends, this may be an opportunity to take advantage of…