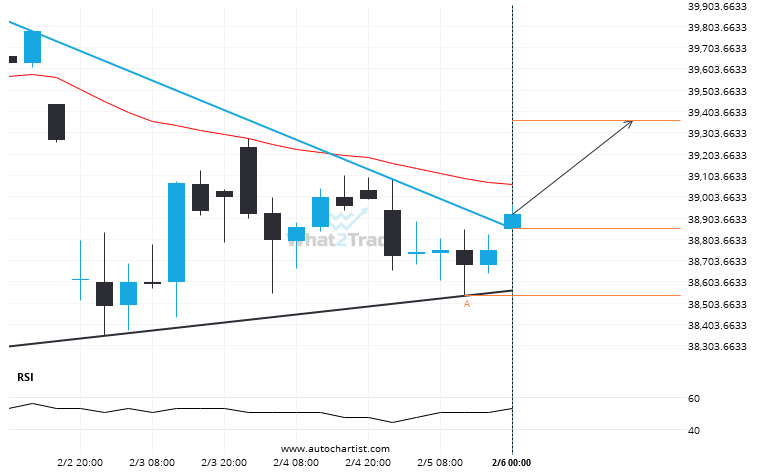
Nikkei 225 has broken through the resistance line of a Triangle technical chart pattern. Because we have seen it retrace from this line in the past, one should wait for confirmation of the breakout before taking any action. It has touched this line twice in the last 10 days and suggests a possible target level to be around 39361.7657 within the next 2 days.
ARTÍCULOS RELACIONADOS
NAS 100 is signaling a possible trend reversal on the intraday charts with price not breaching support.
Emerging Channel Up pattern in its final wave was identified on the NAS 100 4 hour chart. After…
After trying numerous times in the past, FTSE 100 finally breaks 9165.2197!
FTSE 100 has breached the resistance line at 9165.2197. It may continue the bullish trend towards 9220.1670, or,…
Because DAX 40 formed a Inverse Head and Shoulders pattern, we expect it to touch the resistance line. If it breaks through resistance it may move much higher
DAX 40 is moving towards a resistance line which it has tested numerous times in the past. We…