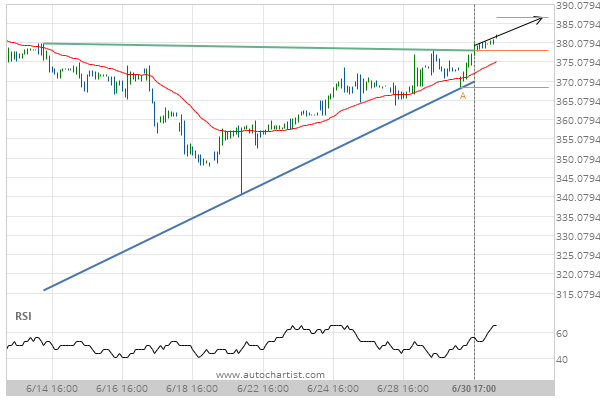
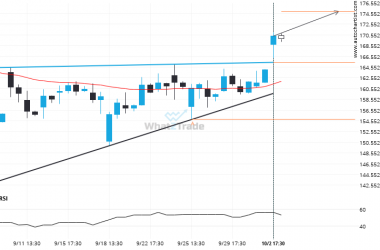
The breakout of Goldman Sachs Group Inc. through the resistance line of a Ascending Triangle could be a sign of the road ahead. If this breakout persists, we expect the price of Goldman Sachs Group Inc. to test 386.54 within the next 2 days. One should always be cautious before placing a trade, wait for confirmation of the breakout before putting any money down.
ARTÍCULOS RELACIONADOS
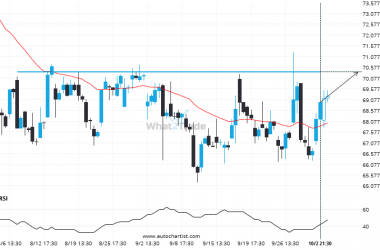
If PYPL touches 70.3750 it may be time to take action.
A strong resistance level has been identified at 70.3750 on the 4 hour PYPL chart. PYPL is likely…
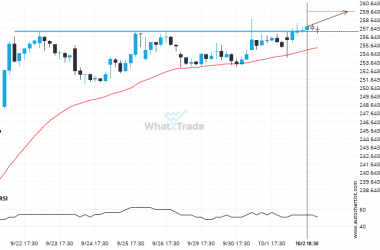
If you’re short AAPL you should be aware that 257.2950 has just been breached – a level tested 3 time in the past
AAPL is once again retesting a key horizontal resistance level at 257.2950. It has tested this level 3…
AMD – breach of a trending resistance line that has been tested at least twice before.
The breakout of AMD through the resistance line of a Ascending Triangle could be a sign of the…

