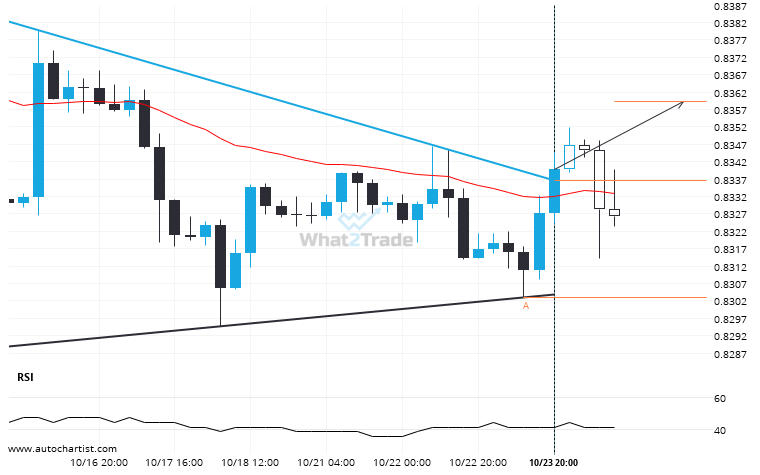
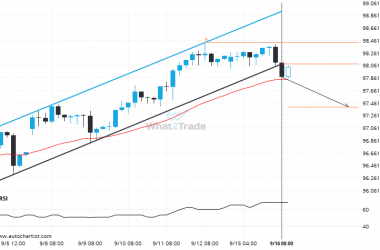
EURGBP moved through the resistance line of a Triangle at 0.8337007407407407 on the 4 hour chart. This line has been tested a number of times in the past and this breakout could mean an upcoming change from the current trend. It may continue in its current direction toward 0.8360.
ARTÍCULOS RELACIONADOS
A possible move on CHFJPY as it heads towards support
CHFJPY is moving towards a support line. Because we have seen it retrace from this line before, we…
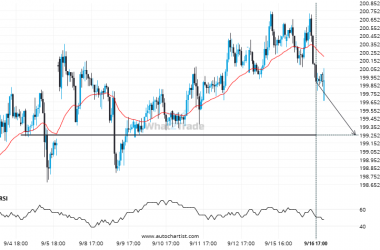
GBPJPY is approaching 199.2480. We expect either a breakout through this line, or a rebound.
A strong support level has been identified at 199.2480 on the 1 hour GBPJPY chart. GBPJPY is likely…
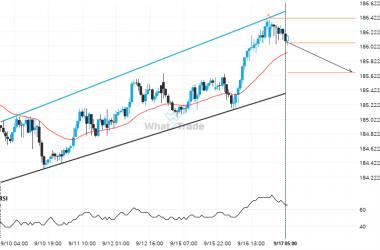
Breach of support could mean a start of a bearish trend on AUDJPY
AUDJPY has broken through a support line of a Channel Up chart pattern. If this breakout holds true,…

