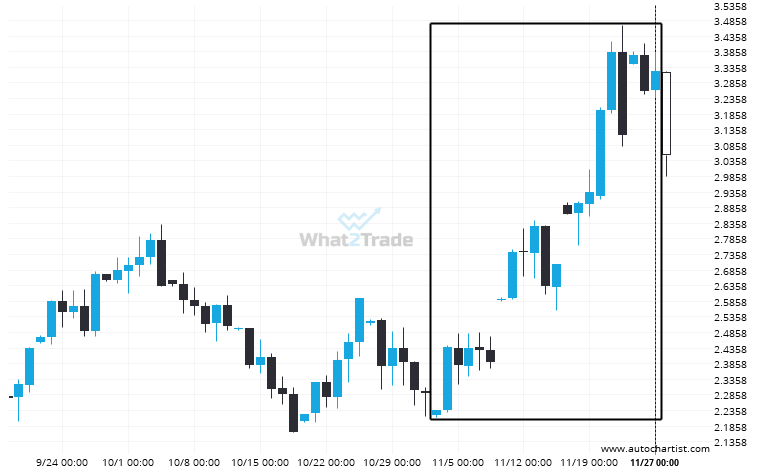
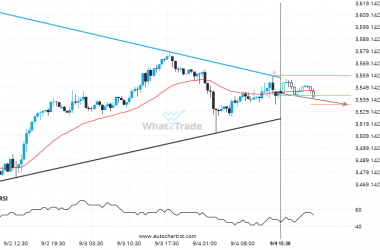
An unexpected large move has occurred on Natural Gas Daily chart beginning at 2.2355 and ending at 3.3215. Is this a sign of something new? What can we expect in the future?
ARTÍCULOS RELACIONADOS
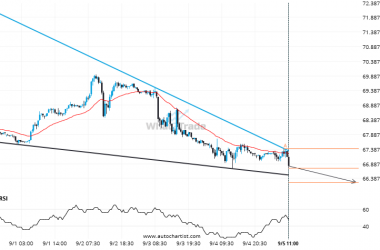
Brent Crude is quickly approaching the support line of a Falling Wedge. We expect either a breakout through this line or a rebound.
Brent Crude is heading towards the support line of a Falling Wedge and could reach this point within…
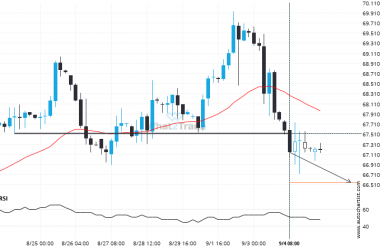
Important price line breached by Brent Crude. This price has been tested numerous times before.
Brent Crude has broken through 67.5205 which it has tested numerous times in the past. We have seen…
Gold Spot – approaching a support line that has been previously tested at least twice in the past
Gold Spot is moving towards a support line which it has tested numerous times in the past. We…

