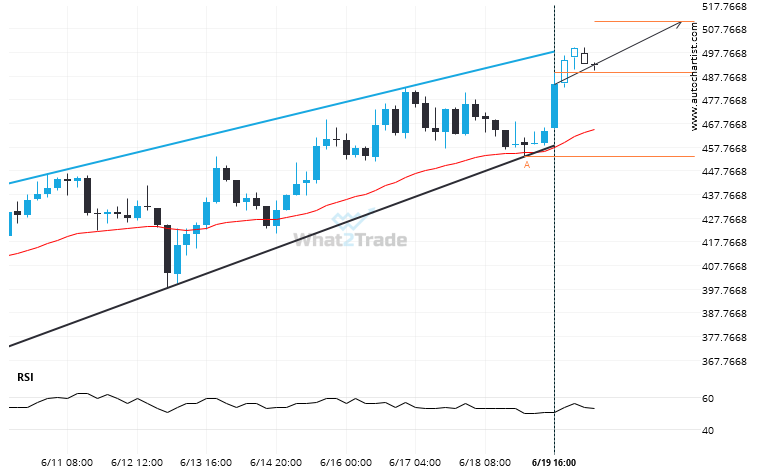
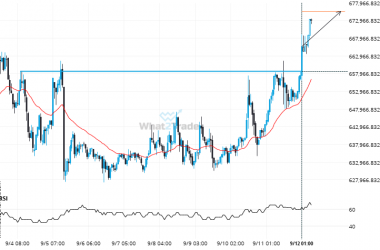
BCHUSD is moving towards a resistance line which it has tested numerous times in the past. We have seen it retrace from this line before, so at this stage it isn’t clear whether it will breach this line or rebound as it did before. If BCHUSD continues in its current trajectory, we could see it reach 510.8960 within the next 3 days.
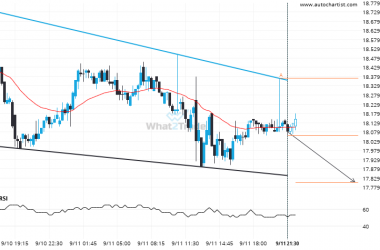
ARTÍCULOS RELACIONADOS
ETHBTC has formed 7 bullish candles successively, what is the probability of getting another bullish candle?
ETHBTC has moved higher after 7 consecutive daily candles from 0.0228 to 0.0255 in the last 10 days.
Important resistance line being approached by LTCUSD. This price has been tested numerous time in the last 2 days
LTCUSD was identified at around 96.59 having recently rebounded of the support on the 30 Minutes data interval.…
LTCEUR moves higher to 80.75 in the last 3 days.
An unexpected large move has occurred on LTCEUR 1 hour chart beginning at 73.08 and ending at 80.75.…