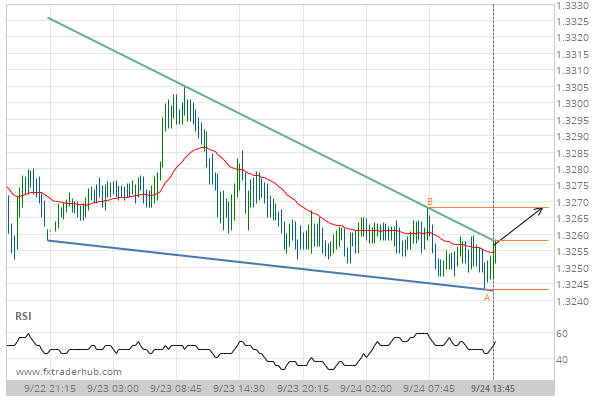
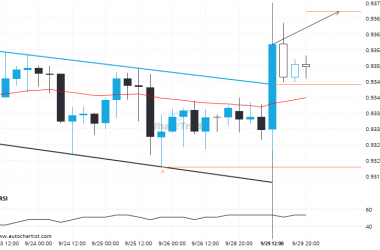
USD/CAD is heading towards the resistance line of a Falling Wedge and could reach this point within the next 13 hours. It has tested this line numerous times in the past, and this time could be no different from the past, ending in a rebound instead of a breakout. If the breakout doesn’t happen, we could see a retracement back down to current levels.
ARTÍCULOS RELACIONADOS
Rare set of bearish consecutive candles on the USDCHF Daily chart. Can we expect a turn-around?
USDCHF has moved lower after 6 consecutive daily candles from 0.8180 to 0.7983 in the last 9 days.
Because EURCAD formed a Channel Up pattern, we expect it to touch the resistance line. If it breaks through resistance it may move much higher
EURCAD is approaching the resistance line of a Channel Up. It has touched this line numerous times in…
GBPCHF seems to be on its way to support – a possible opportunity?
GBPCHF is moving towards a key support level at 1.0950. GBPCHF has previously tested this level 3 times…