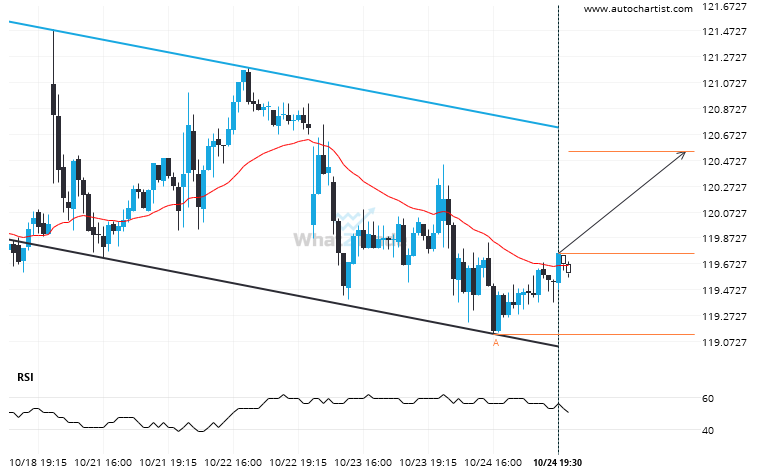
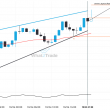
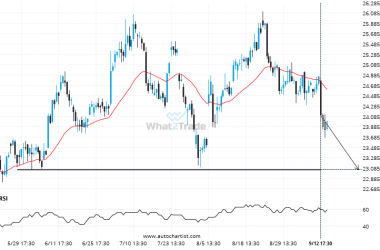
XOM was identified at around 119.75 having recently rebounded of the support on the 15 Minutes data interval. Ultimately, the price action of the stock has formed a Channel Down pattern. This squeeze may increases the chances of a strong breakout. The projected movement will potentially take the price to around the 120.5412 level.
ARTÍCULOS RELACIONADOS
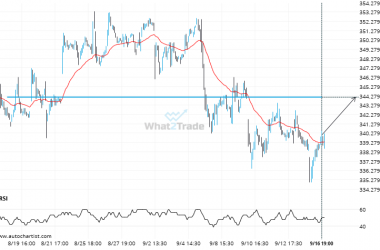
If you’re short V you should be aware of the rapidly approaching level of 344.1500
V is heading towards a line of 344.1500. If this movement continues, the price of V could test…
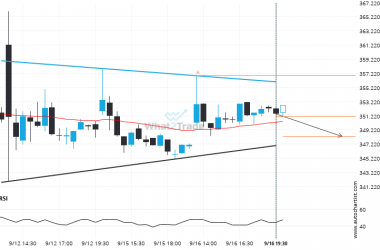
ADBE is approaching a support line of a Triangle. It has touched this line numerous times in the last 6 days.
An emerging Triangle has been detected on ADBE on the 30 Minutes chart. There is a possible move…
Will PFE break through the support level it tested before?
PFE is heading towards 23.0550 and could reach this point within the next 3 days. It has tested…

