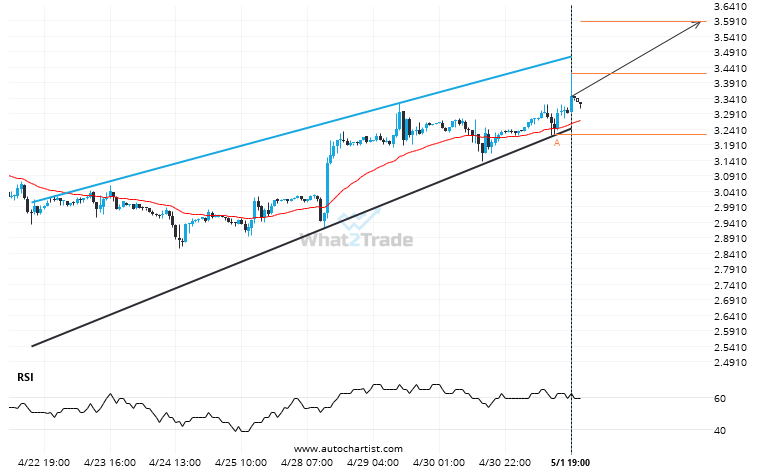
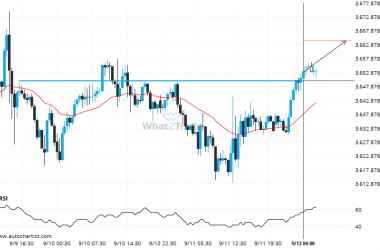
A Rising Wedge pattern was identified on Natural Gas at 3.4205, creating an expectation that it may move to the resistance line at 3.5885. It may break through that line and continue the bullish trend or it may reverse from that line.
ARTÍCULOS RELACIONADOS
Could a large bullish move on US Oil be a sign of things to come?
US Oil hits 59.9475 after a 5.63% move spanning 18 hours.
It’s time to make a decision on Gold Spot – its recent breach of 3260.0820 could be a sign of a new trend to follow.
Gold Spot has broken through 3260.0820 which it has tested numerous times in the past. We have seen…
Rare set of bearish consecutive candles on the Brent Crude Daily chart. Can we expect a turn-around?
Due to the rate of consecutive bearish candles on Brent Crude Daily chart we could be in for…