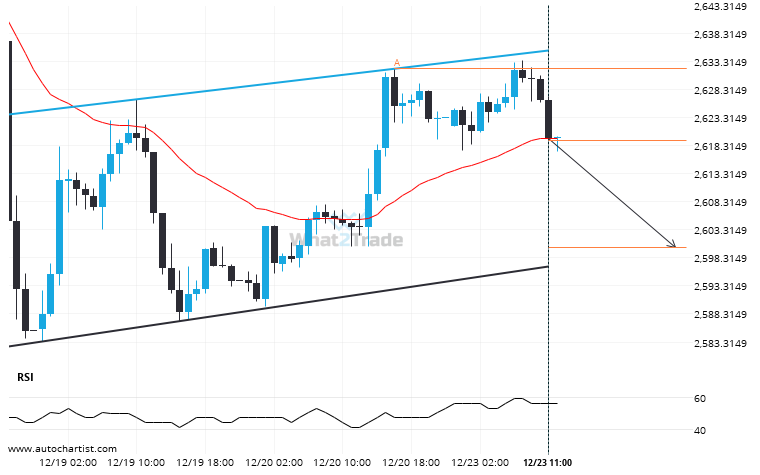
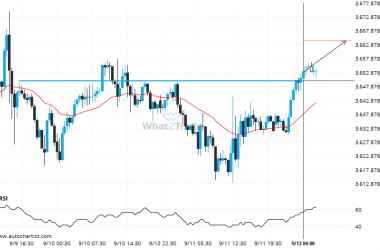
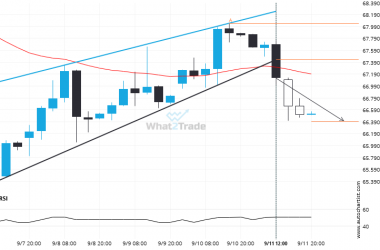
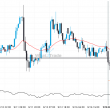
A Channel Up pattern was identified on Gold Spot at 2619.11, creating an expectation that it may move to the support line at 2600.1681. It may break through that line and continue the bearish trend or it may reverse from that line.
ARTÍCULOS RELACIONADOS
After testing the support line numerous times, Gold Spot is once again approaching this line. Can we expect a bearish trend to follow?
Gold Spot is heading towards the support line of a Channel Down. If this movement continues, the price…
Natural Gas seems to be on its way to resistance – a possible opportunity?
A strong resistance level has been identified at 3.4615 on the 30 Minutes Natural Gas chart. Natural Gas…
Important resistance line being approached by Natural Gas. This price has been tested numerous time in the last 5 days
A Channel Down pattern was identified on Natural Gas at 3.3885, creating an expectation that it may move…