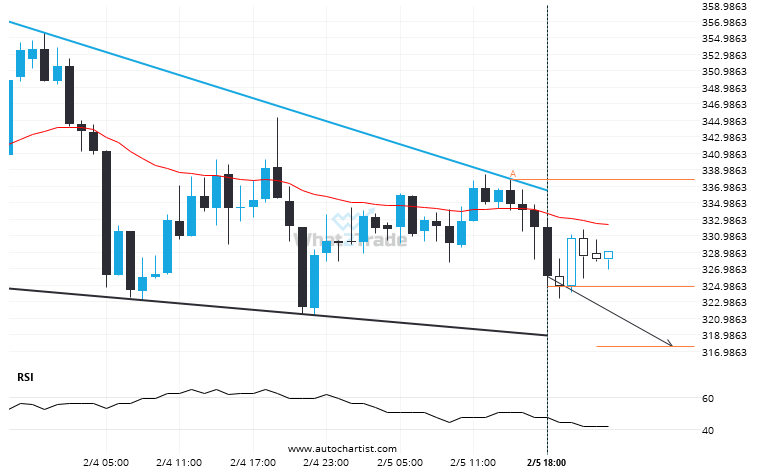
Emerging Falling Wedge pattern in its final wave was identified on the BCHUSD 1 hour chart. After a strong bearish run, we find BCHUSD heading towards the upper triangle line with a possible resistance at 317.5275. If the support shows to hold, the Falling Wedge pattern suggests a rebound back towards current levels.
ARTÍCULOS RELACIONADOS
LTCBTC – approaching a price line that has been previously tested numerous times in the past
The price of LTCBTC in heading back to the support area. It is possible that it will struggle…
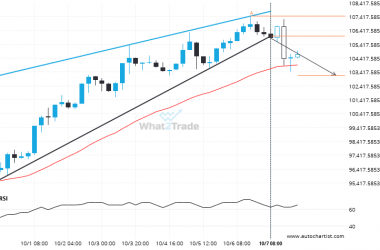
BTCEUR through 106021.44499999998. Is this a confirming a breakout? Will it continue its path in the current trend toward 103177.3167?
Rising Wedge pattern identified on BTCEUR has broken through a support level with the price momentum continuing to…
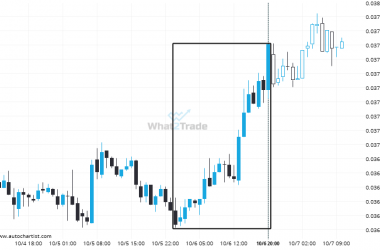
A very large move was recorded on ETHBTC. The size of the shift is exceptional.
ETHBTC has moved higher by 3.48% from 0.03646 to 0.03773 in the last 20 hours.


