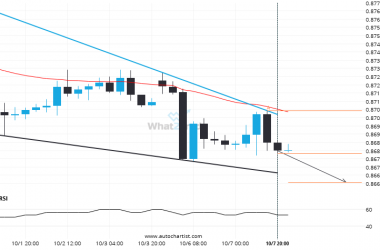
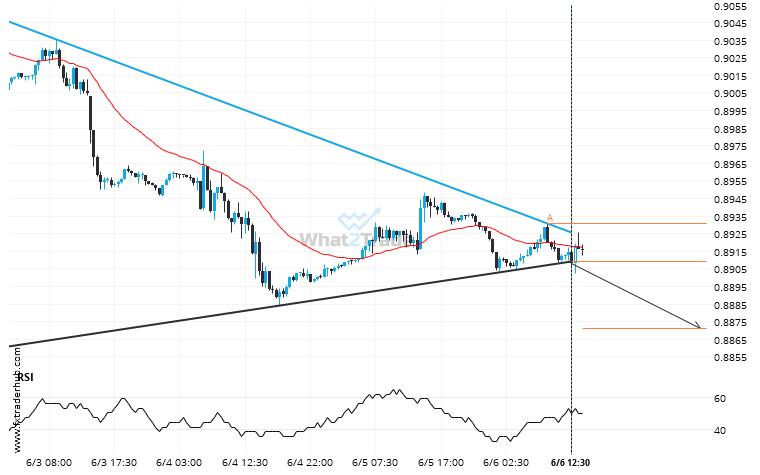
USD/CHF moved through the support line of a Triangle at 0.8909753623188404 on the 30 Minutes chart. This line has been tested a number of times in the past and this breakout could mean an upcoming change from the current trend. It may continue in its current direction toward 0.8872.
ARTÍCULOS RELACIONADOS
EURUSD formed a Channel Up on the 4 hour chart. Retest of resistance in sight.
Emerging Channel Up pattern in its final wave was identified on the EURUSD 4 hour chart. After a…
After experiencing a 2.13% bullish move in the space of 22 days, nobody knows where EURGBP is headed.
An unexpected large move has occurred on EURGBP Daily chart beginning at 0.82743 and ending at 0.84503. Is…
CHFJPY keeps moving closer towards 170.5690. Will it finally breach this level?
CHFJPY is about to retest a key horizontal support level near 170.5690. It has tested this level 3…