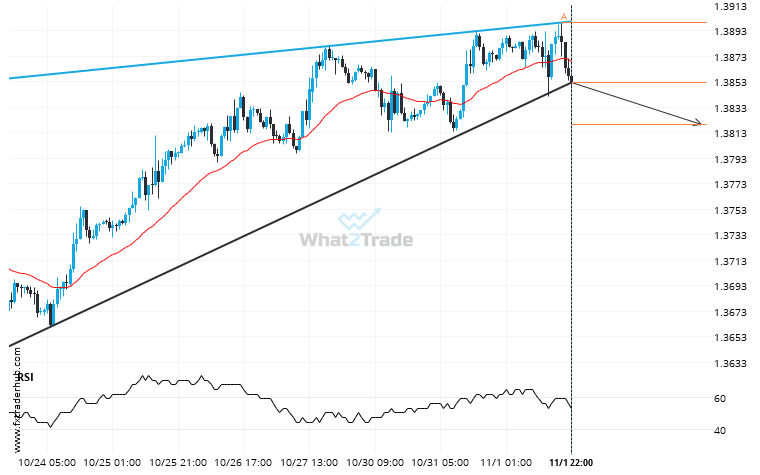
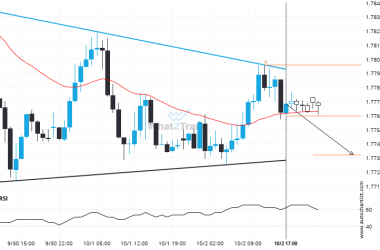
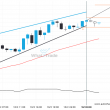
USD/CAD moved through the support line of a Rising Wedge at 1.3852127814569537 on the 1 hour chart. This line has been tested a number of times in the past and this breakout could mean an upcoming change from the current trend. It may continue in its current direction toward 1.3819.
ARTÍCULOS RELACIONADOS
A possible move on NZDUSD as it heads towards support
The movement of NZDUSD towards the support line of a Falling Wedge is yet another test of the…
EURGBP has formed 6 bullish candles successively, what is the probability of getting another bullish candle?
After posting 6 consecutive bullish candles in 7 days, you may start considering where EURGBP is heading next,…
After trying numerous times in the past, AUDCAD finally breaks 0.8564!
A strong resistance level has been breached at 0.8564 on the 15 Minutes AUDCAD chart. Technical Analysis theory…