

Browsing Category
Uncategorized
616 posts
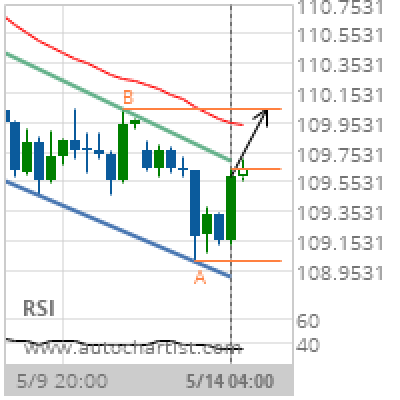
USD/JPY Target Level: 110.0410
Channel Down identified at 14-May-2019 04:00 UTC. This pattern is still in the process of forming. Possible bullish price movement towards the resistance 110.0410 within the next 2 days. Supported by RSI below 40 Chart 4 hourPattern Channel DownLength 33 CandlesIdentified 14-May-2019 04:00 UTC
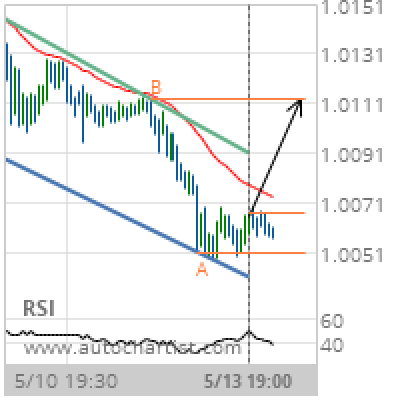
USD/CHF Target Level: 1.0112
Channel Down identified at 13-May-2019 19:00 UTC. This pattern is still in the process of forming. Possible bullish price movement towards the resistance 1.0112 within the next 14 hours. Supported by RSI below 40 Chart 30 MinutesPattern Channel DownLength 105 CandlesIdentified 13-May-2019 19:00 UTC
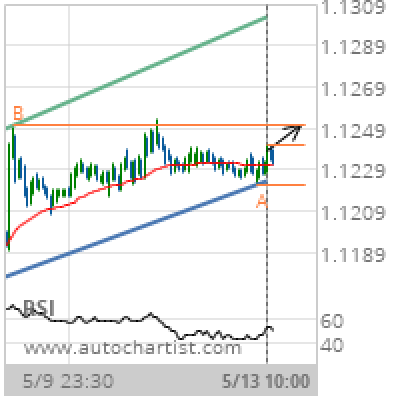
EUR/USD Target Level: 1.1251
Channel Up identified at 13-May-2019 10:00 UTC. This pattern is still in the process of forming. Possible bullish price movement towards the resistance 1.1251 within the next day. Supported by Upward sloping Moving Average Chart 30 MinutesPattern Channel UpLength 151 CandlesIdentified 13-May-2019 10:00 UTC
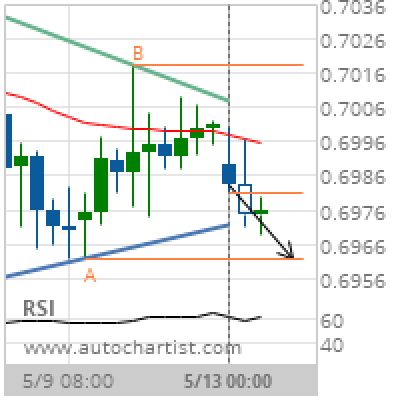
AUD/USD Target Level: 0.6962
Triangle identified at 13-May-2019 00:00 UTC. This pattern is still in the process of forming. Possible bearish price movement towards the support 0.6962 within the next 24 hours. Supported by RSI above 60 Chart 4 hourPattern TriangleLength 25 CandlesIdentified 13-May-2019 00:00 UTC
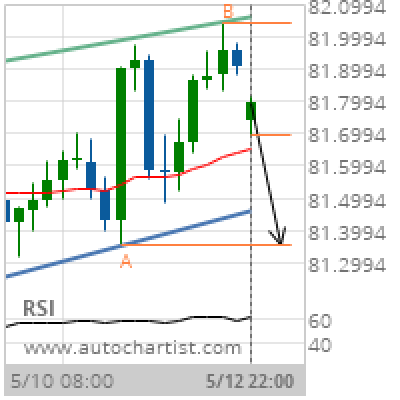
CAD/JPY Target Level: 81.3530
Channel Up identified at 12-May-2019 22:00 UTC. This pattern is still in the process of forming. Possible bearish price movement towards the support 81.3530 within the next 9 hours. Supported by RSI above 60 Chart 1 hourPattern Channel UpLength 30 CandlesIdentified 12-May-2019 22:00 UTC
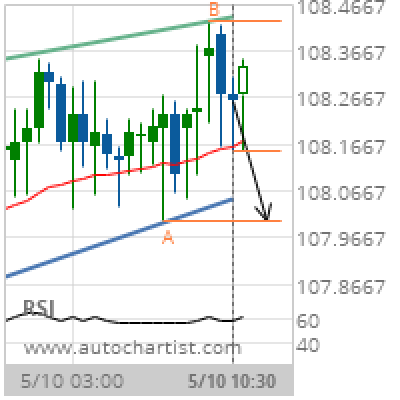
CHF/JPY Target Level: 108.0000
Rising Wedge identified at 10-May-2019 10:30 UTC. This pattern is still in the process of forming. Possible bearish price movement towards the support 108.0000 within the next 5 hours. Supported by RSI above 60 Chart 30 MinutesPattern Rising WedgeLength 36 CandlesIdentified 10-May-2019 10:30 UTC
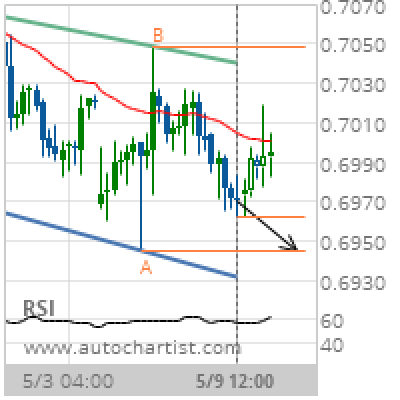
AUD/USD Target Level: 0.6945
Channel Down identified at 09-May-2019 12:00 UTC. This pattern is still in the process of forming. Possible bearish price movement towards the support 0.6945 within the next 2 days. Supported by RSI above 60 Chart 4 hourPattern Channel DownLength 61 CandlesIdentified 09-May-2019 12:00 UTC
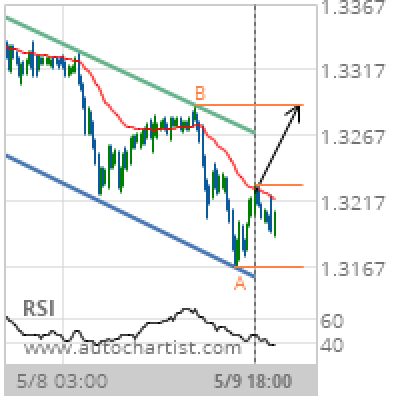
GBP/CHF Target Level: 1.3290
Channel Down identified at 09-May-2019 18:00 UTC. This pattern is still in the process of forming. Possible bullish price movement towards the resistance 1.3290 within the next day. Supported by RSI below 40 Chart 30 MinutesPattern Channel DownLength 170 CandlesIdentified 09-May-2019 18:00 UTC
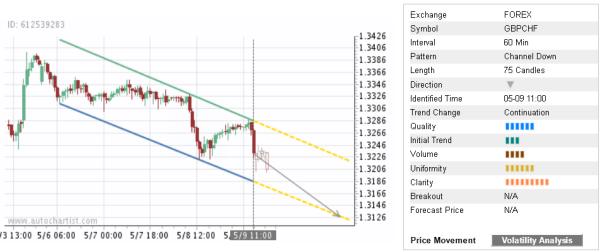
Trade of the Day: GBP/CHF
By: Dima Chernovolov GBP/CHF continues to fall insider the clear hourly Down Channel which was recently identified by Autochartist. Autochartist rates the quality of daily this Down Channel at the 6-bar level – which is the result of the slow Initial Trend (3 bars), above-average Uniformity (6 bars) and significant Clarity (8 bars). GBP/CHF is…
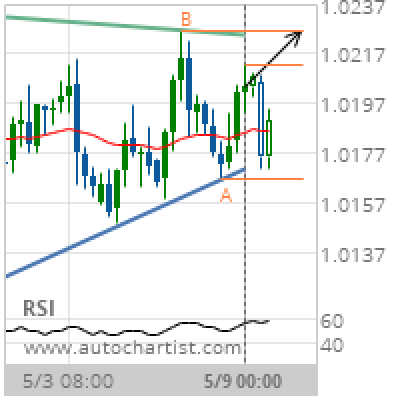
USD/CHF Target Level: 1.0226
Triangle identified at 09-May-2019 00:00 UTC. This pattern is still in the process of forming. Possible bullish price movement towards the resistance 1.0226 within the next 2 days. Supported by Upward sloping Moving Average Chart 4 hourPattern TriangleLength 52 CandlesIdentified 09-May-2019 00:00 UTC