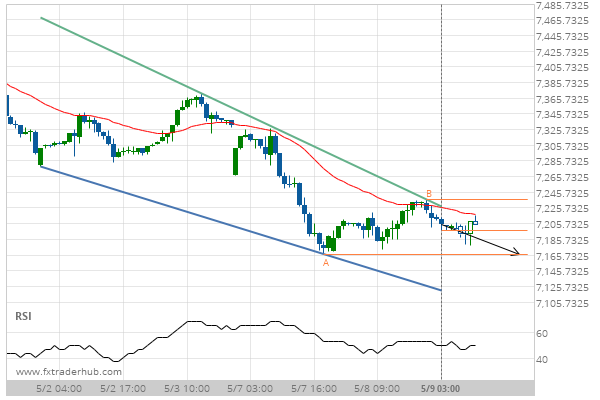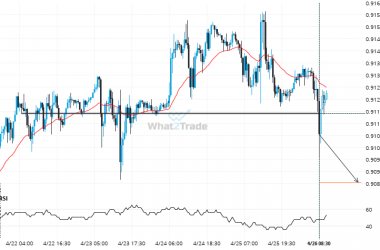
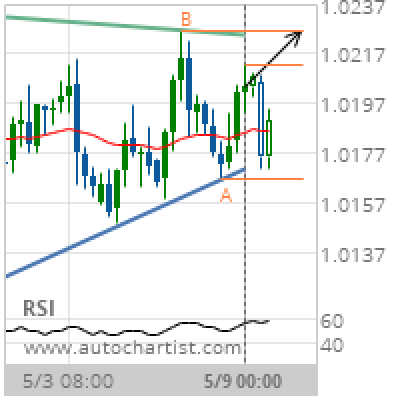

Triangle identified at 09-May-2019 00:00 UTC. This pattern is still in the process of forming. Possible bullish price movement towards the resistance 1.0226 within the next 2 days. Supported by Upward sloping Moving Average
Chart 4 hour
Pattern Triangle
Length 52 Candles
Identified 09-May-2019 00:00 UTC